Saturday , April 20 2024
Home / Tag Archives: coronavirus dashboard

Tag Archives: coronavirus dashboard

100,000+ excess deaths per year

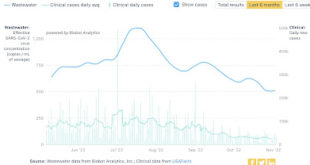
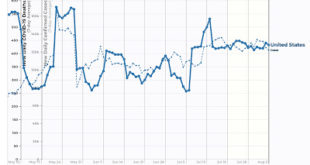
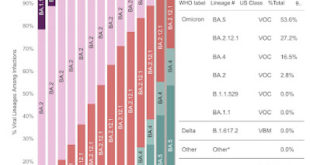
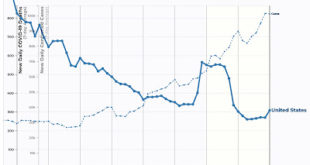
COVID endemicity: 100,000+ (mainly needless) excess deaths per year – by New Deal democrat I suspect these updates are going to be much less frequent from now on; for example, if a significant new wave is evident.  That’s because, as we start our fourth year of the pandemic, the good news is that it is far less lethal than it was during its first two years. From March 2020 through March 2021, 500,000 Americans died of Covid. Another 500,000...

Read More »

Coronavirus dashboard for year end 2022

Coronavirus dashboard for year end 2022: becoming endemic, and still an important threat to seniors  – by New Deal democrat As we close out 2022, let’s look back at the overall picture for COVID. The best historical measure of actual infections is Biobot, which samples wastewater. This is because the advent of easy home testing one year ago meant that far fewer people have had “confirmed” cases this year in comparison to “actual” infections....

Read More »

Coronavirus dashboard for December 7: the first winter wave of endemicity begins

Coronavirus dashboard for December 7: the first winter wave of endemicity begins  – by New Deal democrat COVID is well on its way to becoming endemic, with a significant background level similar to what we have experienced in the last 8 months, and a surge during the winter months when people spend more time socializing together indoors. In that vein, it is apparent that, as expected, Thanksgiving get-togethers have triggered a new wave of...

Read More »

Coronavirus dashboard for Thanksgiving week 2022

Coronavirus dashboard for Thanksgiving week 2022  – by New Deal democrat As we start Thanksgiving week, let’s take a look at the current state of COVID. The Alphabet Soup of variants (most of which are direct descendants of BA.5), primarily BQ.1&1.1, has largely displaced their parent, which is down to 24% of all cases: Typically new waves have peaked when the displaced variant is down to 10% or so of all cases, which should be the...

Read More »

Coronavirus dashboard for November 8, 2022

Coronavirus dashboard for November 8: the new alphabet soup of variants fails to generate a new wave (so far)  – by New Deal democrat Biobot has not updated since late last week, showing COVID particles at or near 6 month lows both nationwide: and in all 4 Census regions: As expected, the CDC’s variant update last Friday showed that BA.5 was down to 40% of all cases, with the alphabet soup of new variants descended from BA.2 and BA.5...

Read More »

Coronavirus dashboard for August 3: is this what endemicity looks like?

Coronavirus dashboard for August 3: is this what endemicity looks like?  – by New Deal democrat Confirmed cases nationwide (dotted line below) declined to 121,700, still within their recent 120-130,000 range. Deaths (solid line) are also steady at 431, within their recent 400-450 range as well: Hospitalizations have plateaued in the past 10 days reported in the 45-47,000 range, and as of July 30 were 46,100. A commenter at Seeking Alpha who...

Read More »

Coronavirus dashboard for July 5: no sign of a BA.4&5 wave in cases yet

Coronavirus dashboard for July 5: no sign of a BA.4&5 wave in cases yet, as the next variant has appeared in India  – by New Deal democrat I haven’t done a Coronavirus dashboard in a couple of weeks, and there have been a few developments, so let’s take a look. First of all, the BA.4&5 variants continue to increase their share of infections in the US, now at 70% of all cases: Regionally, BA.4&5 are most prevalent in the South...

Read More »

Coronavirus dashboard for May 20

Coronavirus dashboard for May 20: signs of a peak in BA.2.12.1 in bellwether jurisdictions; is BA.4/BA.5 next? With no significant economic data today, let’s take a look at where the BA.2.12.1 COVID wave is. Nationwide cases (thin line below) have increased about 3.5x from their bottom of roughly 26,700 five weeks ago, to just over 100,000. Meanwhile, deaths (thick line) appear to still be in the process of making a bottom at under 300 per...

Read More »

Coronavirus dashboard for May 13: the virus will gradually become less lethal

Coronavirus dashboard for May 13: the virus will gradually become less lethal – because you can only die once, COVID-19 is still a pandemic and will gradually transition to an endemic. A year ago I thought that between nearly universal vaccinations and an increasing percentage of the population already infected, the virus would wane into a background nuisance by now. No more.  I am now thoroughly convinced that an unending series of variants...

Read More »

Coronavirus dashboard for April 27: Estimating the BA.2.12.1 wave

Coronavirus dashboard for April 27: Estimating the BA.2.12.1 wave The CDC updated its variant proportions data yesterday. BA.2.12.1 cases grew from 19% to 29% of all US cases:  and from 45% to 60% in NY and NJ. At the other end of the spectrum, BA.2.12.1 was only 9% of cases in the Pacific Northwest and 8% in the South Central region. BA.1 is down to only 2% of cases: Focusing on NY and NJ, NJ has had a little spurt in the...

Read More »