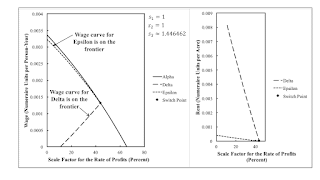
Figure 1: Wage Curves and Rent for an Example of Intensive Rent1.0 Introduction This post is one in a series exploring variations of an example from Antonio D'Agata (1983). This post demonstrates that at least one of my fluke cases can appear in a model of intensive rent by varying a parameter specifying relative markups among sectors. This post is only a start of exploring the parameter space of relative markups in a specific numeric example of intensive rent. Suppose the rate of profits is given, subject to the constraint that the ratios of the rate of profits in agriculture to that in other industries are as specified. Then the wage can be one of two distinct levels. When the wage is at the lower level, then the rent per acre is higher and vice versa. On the other hand, an
Topics:
Robert Vienneau considers the following as important: Full Cost Prices, rent
This could be interesting, too:
Robert Vienneau writes Variations In An Analysis Of Intensive Rent With One Type Of Land (Part 2/2)
Robert Vienneau writes Variations In An Analysis Of Intensive Rent With One Type Of Land (Part 1/2)
Robert Vienneau writes Intensive Rent With Two Types Of Land
Robert Vienneau writes Intensive Rent And The Order Of Rentability
| Figure 1: Wage Curves and Rent for an Example of Intensive Rent |
This post is one in a series exploring variations of an example from Antonio D'Agata (1983).
This post demonstrates that at least one of my fluke cases can appear in a model of intensive rent by varying a parameter specifying relative markups among sectors. This post is only a start of exploring the parameter space of relative markups in a specific numeric example of intensive rent.
Suppose the rate of profits is given, subject to the constraint that the ratios of the rate of profits in agriculture to that in other industries are as specified. Then the wage can be one of two distinct levels. When the wage is at the lower level, then the rent per acre is higher and vice versa. On the other hand, an increased wage, when it is at the lower level is associated with an increased rate of profits.
2.0 Technology, Requirements for Use, Endowments, and Relative MarkupsTable 1 presents coefficients of production in an example from D'Agata (1983). Only one type of land exists, and three processes are known for producing corn on it. The scarcity of land is shown by the possibility of two corn-producing processes being operated side-by-side in the cost-minimizing technique.
| Input | Industry | ||||
| Iron | Steel | Corn | |||
| I | II | III | IV | V | |
| Labor | 1 | 1 | 1 | 11/5 | 1 |
| Land | 0 | 0 | 1 | 1 | 1 |
| Iron | 0 | 0 | 1/10 | 1/10 | 1/10 |
| Steel | 0 | 0 | 2/5 | 1/10 | 1/10 |
| Corn | 1/10 | 3/5 | 1/10 | 3/10 | 2/5 |
Following D'Agata, assume that one hundred acres of land are available and that net output consists of 90 tons iron, 60 tons steel, and 19 bushels corn. The net output is also the numeraire. All three commodities must be produced for any composition of net output. Table 2 lists the available techniques. Only Alpha, Delta, and Epsilon are feasible for these requirements for use. Not all land is farmed and only one corn-producing process is operated under Alpha. Two corn-producing processes are operated together under Delta and Epsilon.
| Technique | Processes |
| Alpha | I, II, III |
| Beta | I, II, IV |
| Gamma | I, II, V |
| Delta | I, II, III, IV |
| Epsilon | I, II, III, V |
| Zeta | I, II, IV, V |
In the non-competitive case, the relative markups in different industries are taken as given. Let the rates of profits be in proportions of s1, s2, and s3, respectively.
3.0 Prices of ProductionPrices of prodution can be defined for each technique. Each process operated in a technique contributes an equation in which the going rate of profits are obtained for that industry. The rate of profits in producing iron is s1r. In steel, it is s2r, and it is s3r in the corn-producing processes. As in past posts, I call r the scale factor for the rate of profits.
For example, the following equations specify prices of production for the Delta technique:
(p1a1,1 + p2a2,1 + p3a3,1)(1 + s1r) + w a0,1 = p1
(p1a1,2 + p2a2,2 + p3a3,2)(1 + s2r) + w a0,2 = p2
(p1a1,3 + p2a2,3 + p3a3,3)(1 + s3r) + ρ c3 + w a0,2 = p3
(p1a1,4 + p2a2,4 + p3a3,4)(1 + s3r) + ρ c4 + w a0,3 = p3
In these equations, p1, p2, and p1 are the prices of iron, steel, and corn. The wage is denoted by w, and ρ denotes rent per acre. The techology provides the coefficients of production in this system of equation. The specification of the numeraire specifies another equation.
90 p1 + 60 p2 + 19 p3 = 1
One degree of freedom remains. I take the the scale factor for the rate of profits as externally given in this post.
In solving the above system, a linear combination of the two equations for corn-producing processes can be taken such that rent drops out. Prices of iron, steel, and corn and the wage can be found first. Then one can obtain rent per acre from either one of the corn-producing processes. Only ranges of the scale factor are considered in which prices, the wage, and rent are non-negative.
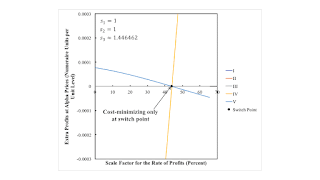
4.0 Choice of TechniqueA technique is cost-minimizing, at a given scale factor for the rate of profits, if it is feasible and extra profits cannot be obtained by operating any process outside the technique. In evaluating a process to see if extra profits can be obtained by running it, one uses the prices of production determined by the technique and the scale factor for the rate of profits. Extra profits in the processes comprising the technique are zero, neither positive nor negative.
| Figure 2: Extra Profits for Alpha Prices |
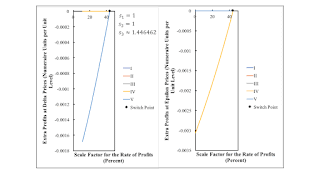
Figure 2 shows that Alpha is cost-minimizing only at the scale factor for the rate of profits. If the scale factor were less than this, extra profits would be gained by combining the last corn-producing process with the first. That is, starting from the Alpha technique, capitalists in agriculture would adopt the Epsilon technique. As demonstrated by the right pane in Figure 3, Epsilon is cost-minimizing for any positive scale factor for the rate of profits up to that at the switch point. Delta is cost-minimizing from a scale factor for the rate of profits where the rate of profits turns positive up to the switch point.
| Figure 3: Extra Profits for Delta and Epsilon Prices |
Above the switch point, the rate of profits for Alpha is positive up to a certain maximum. In this range, extra profits can be made by operating process IV. The Beta technique would be selected if this process entirely replaced the corn-minimizing technique in Alpha. But Beta is not feasible. On the other hand, processes III and IV are operated side-by-side in the Delta technique. But in this range for the scale factor for the rate of profits, Delta obtains a negative rent. So no cost-minizing technique exists for a scale factor for the rate of profits greater than that at a switch point.
| Lower Bound on r | Upper Bound on r | Techniques |
| 0 percent | 11.1 percent | Delta has a negative rate of profits |
| Epsilon has a positive rate of profits and positive rent | ||
| Epsilon is uniquely cost-minimizing | ||
| 11.1 percent | 43.9 percent | Delta has a positive rate of profits and positive rent |
| Epsilon has a positive rate of profits and positive rent | ||
| Delta is non-uniquely cost-minimizing | ||
| Epsilon is non-uniquely cost-minimizing | ||
| 43.9 percent | 65.5 percent | Delta has negative rent |
| Epsilon has positive rent | ||
| Alpha has a positive rate of profits | ||
| No cost-minimizing technique exists |
Table 3 summarizes this analysis of the cost-minimizing technique for this fluke case with markup pricing and intensive rent. Before the switch point, the wage frontier consists of both the wages curves for the Delta and Epsilon techniques. The wage frontier does not exist after the switch point. D'Agata's original example, with competitive markets, also illustrates the possibility of a range of the rate of profits with multiple cost-minimizing techniques away from a switch point. And he also notes the possibility of the non-existence of a cost-minimizing technique.
5.0 ConclusionFluke cases are associated with qualitative change in the analysis of the choice of technique. Such fluke cases can be brought about by technological improves, that is, changes in coefficients of production. This numerical example illustrates that one of these fluke cases can also be brought about changes in market power between agriculture and industry. In this fluke case, three wage curves intersect at a single switch point.
If agriculture does not have quite as much market power as in the example, a range of the scale factor for the rate of profits exists where both Alpha and Delta are cost-minimizing. For the higher wage, landlords cannot exist since land is not scarce and obtains no rent. This variation in whether or not land is scarce with variations in distribution is not about net output. The level and composition of net output is taken as fixed in the above analysis. The fluke case is associated with the disappear of the range of the rate of profits in which Alpha is cost-minimizing. If agriculture has more market power than in the example, Alpha is never cost-minimizing.
This particular example of markup pricing and intensive rent can be further explored. What other fluke cases exist? What happens if the iron and steel industries do not have the same market power?
Reference- D'Agata, Antonio. 1983. The existence and unicity of cost-minimizing systems in intensive rent theory. Metroeconomica 35: 147-158'
 Heterodox


