In a previous post I undertook a very simple analysis to show that factor investing during inflation helps investors to stop from simply treading water – at least, if history is any guide. An interlocutor asked if I’d looked into quality factors and I said that I would get around to it. In fact, there is something very interesting in the quality factor analysis – something that highlights an aspect of inflation that is not properly appreciated by most economists and investors. First, let us take a look at how returns stack up during inflations for the standard Fama-French quality factors. Once again, I will be using my ‘factor enhancement’ ratio – that is, the ratio of average returns during various levels of inflation relative to the total average return for that factor.
Topics:
Philip Pilkington considers the following as important: Uncategorized
This could be interesting, too:
tom writes The Ukraine war and Europe’s deepening march of folly
Stavros Mavroudeas writes CfP of Marxist Macroeconomic Modelling workgroup – 18th WAPE Forum, Istanbul August 6-8, 2025
Lars Pålsson Syll writes The pretence-of-knowledge syndrome
Dean Baker writes Crypto and Donald Trump’s strategic baseball card reserve
In a previous post I undertook a very simple analysis to show that factor investing during inflation helps investors to stop from simply treading water – at least, if history is any guide. An interlocutor asked if I’d looked into quality factors and I said that I would get around to it.
In fact, there is something very interesting in the quality factor analysis – something that highlights an aspect of inflation that is not properly appreciated by most economists and investors.
First, let us take a look at how returns stack up during inflations for the standard Fama-French quality factors. Once again, I will be using my ‘factor enhancement’ ratio – that is, the ratio of average returns during various levels of inflation relative to the total average return for that factor. Here are the results.

Note that we have taken seperate deciles, more on that in a moment.
First of all, what is the broad picture? Before getting into it we should note that this data only runs from the late-1960s. So, we only really have access to one inflation. That said, a striking trend emerges. Whereas the investment factor performs unusally well in inflations, the operating profitability factor performs unusally poorly.
This is in contrast to when we tested value, small and momentum, which all saw a boost from inflation. Ditto for utilising quality factors during the 1972-82 inflation: using the investment factor would have been a big winner, while using the profitability factor would have been a big loser.
Why is this? This is where the deciles come in to give us a hint. As the reader can see in the above, the negative impact on the profitability gets worse the smaller the decile used. The numbers above do not quite do justice to this effect, which can bee seen in the chart below.

The inflationary period 1972-82 in this chart is marked in grey. As we can see, the inflation did such damage to excess returns in the 10% decile that this index never really regained its ground after this. Why?
Let’s step back and recall that what this index represents is: outperformance of companies with unusually high profitability. Why would these companies be so negatively impacted by inflation?
Put another way: we know that all of the high profitability companies are impacted negatively by inflation, but as we move up the ladder this impact gets stronger – what does this suggest?
Well, it appears to suggest that inflation has a negative impact on profit margins – and the higher the profit margin, the worse the impact. This brings us to a little known fact about inflation more generally: from a macroeconomic point-of-view, inflation is a distributionary phenomenon.
We can show this using a simple national accounting identity which runs:

This is no abstract economic theorem. It fits the data from the inflation and national accounting statistics perfectly, as can be seen in the chart below (wage share is inverted to make the picture clear).

Recall that in the national account, the wage share is the inverse of the profit share. Translating from national accounting language into investment language: the profit share is simply profit margins. So, we can say that profit margins are ultimately determined by the change in prices relative to the rise in labour compensation and productivity.
We will not go too much into this fascinating identity. Much could be said. For now, we just need to get a sense that profit margins are likely to be impacted by inflation.
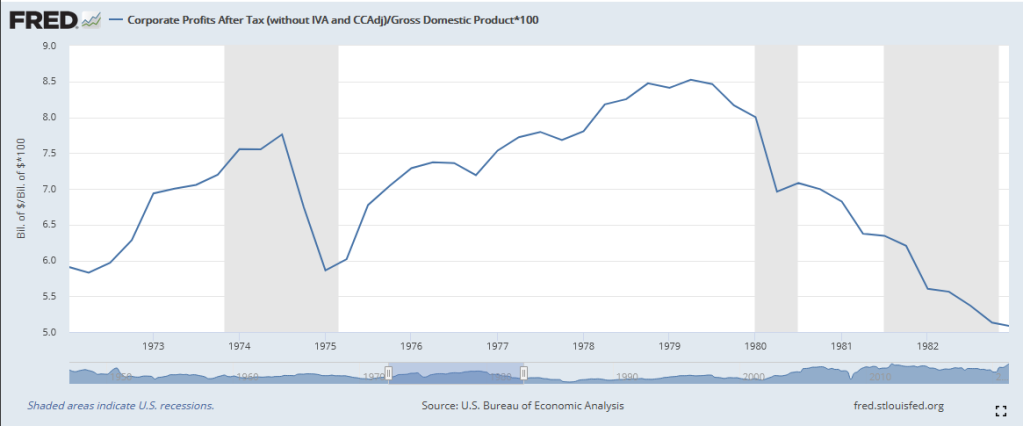
All very good in theory, but what did macro-level corporate profits look like in this period?

A mixed bag, really. They did a round trip in the whole period. Needless to say: they were volatile.
That is more than enough for our purpose. It implies that profitability was shaken during this period. It is no surprise then, to see that firms’ chosen for their profitability saw their returns shaken too. With all this redistribution taking place via changes in both relative and aggregate price-levels, it would not be surprising at all to see redistribution of relative profit margins taking place between firms.
The lesson is clear: you probably do not want to rely on a factor during a period when the economic underpinnings of that factor become highly volatile. Hence why the more ‘concentrated’ that factor becomes – i.e. the further up the deciles we go – the more the volaitility of the economic fundamentals impacts the factor.
