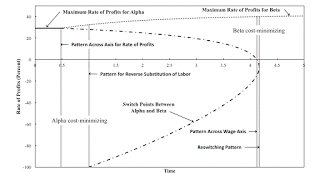
Figure 1: Variation of Switch Points with Time1.0 Introduction This post presents another local pattern of co-dimension one. I have conjectured that only four types of local patterns of co-dimension one exist (a reswitching pattern, a three-technique pattern, a pattern across the wage axis, and a pattern over the axis for the rate of profits). In this conjecture, I meant to implicitly limit the rate of profits at which switch points occur to be non-negative and not exceeding the maximum rate of profits. The pattern illustrated in this post is a pattern around the rate of profits of -100 percent. (I was prompted to develop this example by an anonymous comment, as I was also prompted for this post.) Although this is a local pattern, its interest comes from global effects. Suppose
Topics:
Robert Vienneau considers the following as important: Example in Mathematical Economics, Labor Markets, Sraffa Effects
This could be interesting, too:
Robert Vienneau writes Austrian Capital Theory And Triple-Switching In The Corn-Tractor Model
Robert Vienneau writes Double Fluke Cases For Triple-Switching In The Corn-Tractor Model
Robert Vienneau writes The Emergence of Triple Switching and the Rarity of Reswitching Explained
Robert Vienneau writes Recap For A Triple -Switching Example

|
| Figure 1: Variation of Switch Points with Time |
This post presents another local pattern of co-dimension one. I have conjectured that only four types of local patterns of co-dimension one exist (a reswitching pattern, a three-technique pattern, a pattern across the wage axis, and a pattern over the axis for the rate of profits). In this conjecture, I meant to implicitly limit the rate of profits at which switch points occur to be non-negative and not exceeding the maximum rate of profits. The pattern illustrated in this post is a pattern around the rate of profits of -100 percent. (I was prompted to develop this example by an anonymous comment, as I was also prompted for this post.)
Although this is a local pattern, its interest comes from global effects. Suppose another switch point exists, other than the one at a rate of profits of -100 percent. This other switch point involves the same two techniques and occurs at a positive rate of profits. A perturbation of coefficients of production around the pattern changes the other switch point from one exhibiting a conventional substitution of labor to the reverse substitution of labor. Han and Schefold (2005) describe empirical examples of the reverse substition of labor.
2.0 TechnologyTable 1 specifies the technology for this example. I make the usual assumptions. Each column lists inputs per unit output for each process. Each process exhibits constant returns to scale. Each process requires a year to complete, and there are no joint products. Inputs of capital goods are totally used up in production.
| Input | Iron Industry | Corn Industry | |
| Alpha | Beta | ||
| Labor | 1 Person-Yr. | 9/10 | 0.994653826 e-σ t |
| Iron | (7/10) Ton | 1/40 | 0.002444903 e-σ t |
| Corn | 2 Bushels | 1/10 | 0.746512055 e-σ t |
In this example, technical change occurs in the Beta process for producing corn. I assume that σ is 1/10. So coefficients of production fall at a rate of ten percent.
At any moment of time, two techniques can be created out of these processes. The Alpha technique consists of the iron-producing process and the corn-producing process labeled Alpha. Likewise, the Beta technique consists of the iron-producing process and the corn-producing process labeled Beta.
3.0 Prices and Structural Economic DynamicsI consider a common system for defining prices of production. Relative spot prices are assumed to be constant, and the same rate of profits is earned in both industries for the cost-minimizing technique. Labor power is advanced, and wages are paid out of the surplus product at the end of the year. For a technique that is not cost-minimizing, the costs for operating the corn-producing process in this technique, as evaluated at prices of production, exceed the revenues. I take a bushel corn as the numeraire.
These assumptions allow one to construct wage curves for each technique. The cost-minimizing technique at, say, a given rate of profits is found from the outer envelopes of the wage curves, that is, the wage frontier. Switch points arise at rate of profits for which both techniques are cost-minimizing. For this example, I do not present wage curves at selected moments of time. Figure 1 graphs the rate of profits at switch points and the maximum rate of profits against time. Patterns, including a pattern for the reverse substitution of labor, are indicated on the graph.
3.1 A Superficial Neoclassical StorySuppose one limits one's analysis to non-negative rates of profits. Figure 1 shows that technical progress leads to a switch point at the maximum rate of profits. As the wage curve for the Beta technique continues to move outward, this switch point falls below the maximum rate of profits. For rate of profits lower than at the switch point, the Alpha technique is cost-minimizing. The Beta technique is cost-minimizing at higher rates of profits. Eventually, the switch point disappear across the wage axis, and only the Beta technique is cost-minimizing.
This story initially seems to correspond to exploded neoclassical intuition about technical change. Reswitching and capital-reversing - two phenomena much emphasized in the Cambridge Capital Controversy - never occur. Around the switch point with a positive rate of profits, the Beta technique is cost-minimizing at a notionally smaller wage, and the Alpha technique is cost-minimizing at a notionally higher wage. A lower wage is associated with a technique in which greater labor inputs, aggregated across both industries, are employed per bushel of corn produced net.
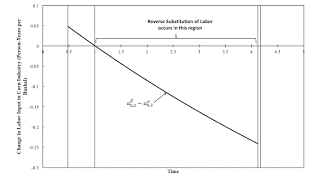
3.2 A Region in which the Reverse Substitution of Labor OccursBut consider what happens when the analysis is extended to a rate of profits of -100 percent. A switch point with a positive rate of profits exists only for time between the patterns over the axis for the rate of profits and the wage axis. Figure 2 graphs the difference in the labor coefficients with time. After the pattern for the reverse substitution of labor, the labor coefficient for the Alpha process in producing corn exceeds the labor coefficient for the Beta process in producing corn. That is, around the switch point, the adoption of the cost-minimizing technique at a lower wage results in less labor being employed in corn production per unit corn produced gross. How is this consistent with the textbook account of labor demand functions?

|
| Figure 2: Change in Labor Input per Unit Gross Output in Corn |
The more I investigate price theory, the less I understand how economists can teach neoclassical microeconomics.
 Heterodox
