By Ana Luíza Matos de Oliveira Brazil is a highly unequal country — so is the access to its higher education system. However, in the beginning of the 21st century (2001-2015), there was a convergence between the profile of Brazilian higher education students and the Brazilian population in terms of income, race, and region, although many inequalities still exist. Now, this process might be at risk. From 2001 to 2015, economic growth and improvements in the labor market affected families’ spending decisions. Also, the budget for higher education presented significant growth and many programs aiming at democratizing access to higher education in Brazil — such as Reuni (expansion of the federal higher education system), Prouni (offer of scholarships in private institutions), loan
Topics:
Michael Stephens considers the following as important: Brazil, distribution, Education, inequality
This could be interesting, too:
Jeremy Smith writes UK workers’ pay over 6 years – just about keeping up with inflation (but one sector does much better…)
Matias Vernengo writes The behavior of the nominal exchange rate between the Brazilian Real and the dollar in 2024
Joel Eissenberg writes The Trump/Vance Administration seeks academic mediocrity
Bill Haskell writes Study Shows Workers Fleeing States With Abortion Bans
by Ana Luíza Matos de Oliveira
Brazil is a highly unequal country — so is the access to its higher education system. However, in the beginning of the 21st century (2001-2015), there was a convergence between the profile of Brazilian higher education students and the Brazilian population in terms of income, race, and region, although many inequalities still exist. Now, this process might be at risk.
From 2001 to 2015, economic growth and improvements in the labor market affected families’ spending decisions. Also, the budget for higher education presented significant growth and many programs aiming at democratizing access to higher education in Brazil — such as Reuni (expansion of the federal higher education system), Prouni (offer of scholarships in private institutions), loan schemes for students, affirmative action, and student assistance — were created or broadened. Policies in partnership with the private sector were put in place and are related to a significant growth in enrollment in private institutions in this period.
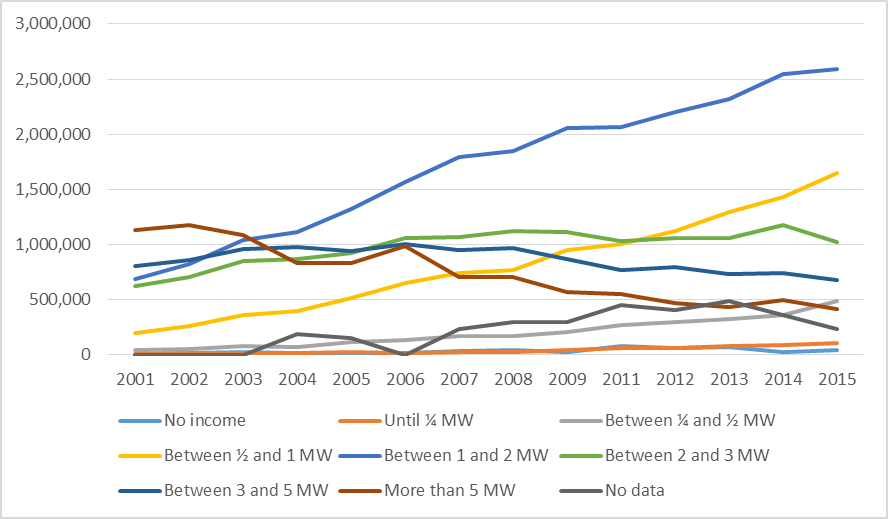
This led to greater social inclusion in higher education, as Graph 1 demonstrates.[1] It is also important to state that during this period there was a policy of increasing the value of the minimum wage (MW), which in 2020 is now R$ 1045 (USD 205).
Graph 1 – Students in Higher Education according to per capita income – Brazil (2001-2015)

Source: A. L. M. Oliveira (2019)
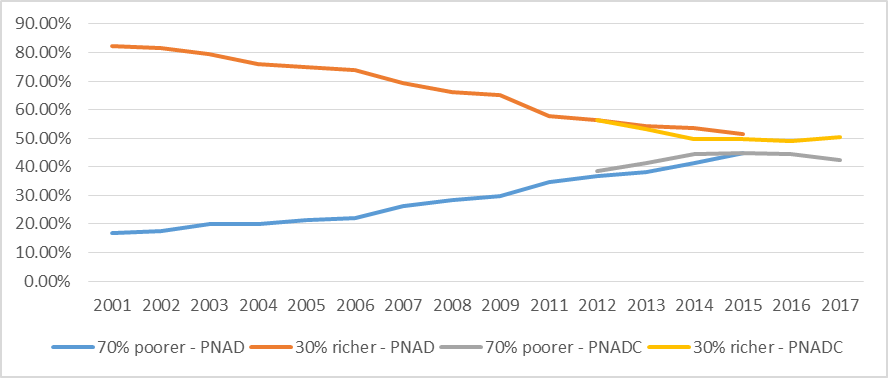
Graph 2 shows a rising trend of participation in higher education among people from the bottom 70% of the Brazilian income distribution (per capita family income) and a decrease in participation among the richest 30%. However, there is a sign of reversal in 2015.[2]
Graph 2 – Participation of the poorest 70% and richest 30% as higher education students – Brazil (2001 – 2017)

Source: Oliveira, A. L. M. (2019)
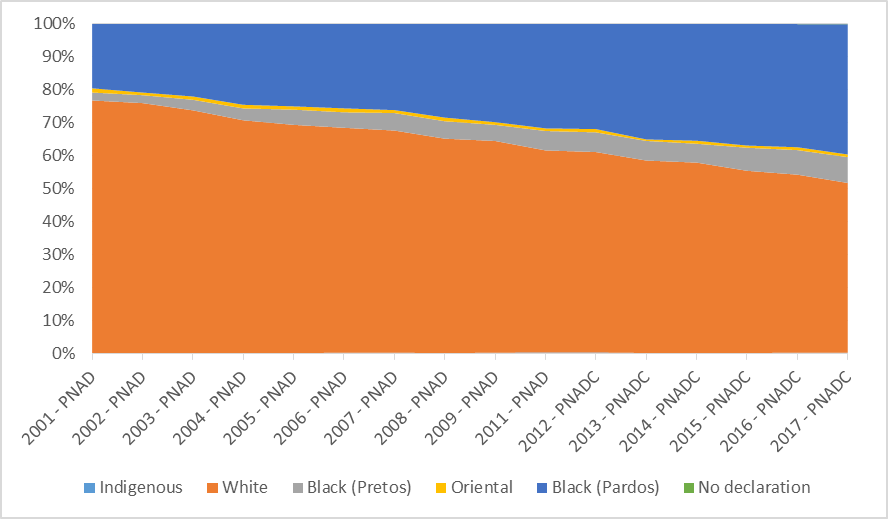
The inclusion was also seen in terms of race. The black population (pretos and pardos) makes up more than half the Brazilian population but registers lower on many socioeconomic indices due to Brazil’s history of slavery. Their participation in higher education rose from 21,9% of students in 2001 to 43,5% of students in 2015. This trend seems to have continued after 2015, although black families have been substantially more hit by the economic crisis than white families. This could indicate that public policies for inclusion in higher education that are still in place (such as affirmative action) could be playing an important role in maintaining this trend (Graph 3).
Graph 3 – Student distribution by race – Brazil (2001 – 2017)

Source: Oliveira, A. L. M. (2019)
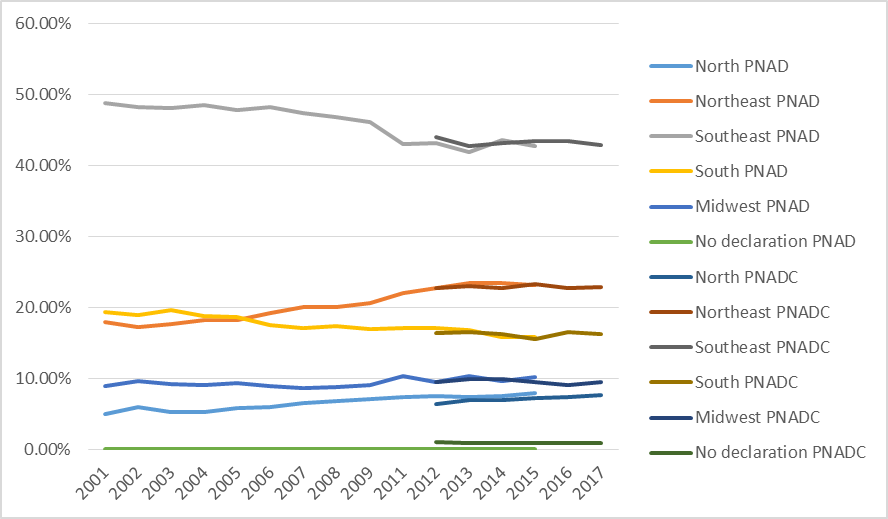
As for regions, the North and Northeast increased participation in the share of students (the North and Northeast are regions with lower socioeconomic indices), although this process was faster in the beginning of the period and slows down in more recent years.
Graph 4 – Percentage of higher education students per region, %, Brazil (2001– 2017)

Source: Oliveira, A. L. M. (2019)
Therefore, there was a reduction in inequalities in access to higher education in Brazil, at least until 2015, with a convergence of the profile of students to that of the Brazilian society in terms of income, race, and region.
However, from 2015 on, a crisis hit the labor market and severe cuts were made to the higher education budget. This context is aggravated by Constitutional Amendment 95/2016, which, under an austerity paradigm, freezes primary expenditures in real terms at 2016 levels until 2036—even if there is growth in the population or in GDP. Therefore, for there to be growth in the budget for higher education policies, there must be a cut in other areas such as culture or health. The Amendment also froze a constitutional guarantee that expenditures on health and education would grow according to growth in public revenue.
The impacts of this strategy towards a reduction of public spending is already visible in the data: from 2015 on, the trend toward inclusion has at least slowed down, and in some cases might have already been reversed.
Regarding the two main factors that provoked a reduction in inclusion (a crisis in the labor market and cuts to social policies), if in theory the situation in the labor market improves again and affects families’ spending decisions (which is not very likely now with the coronacrisis), cuts to social policy will still be the norm until 2036 under the austerity paradigm—to the suffering of the generations to come.
[1] The data originates from my Thesis (https://www.academia.edu/38960727/Educa%C3%A7%C3%A3o_Superior_brasileira_no_in%C3%ADcio_do_s%C3%A9culo_XXI_inclus%C3%A3o_interrompida).
[2] This was calculated according to PNAD (for 2001 to 2015) and PNADC (for 2012 to 2017). PNAD was discontinued in 2015 and PNADC was created in 2012.
$title = the_title('','',false); ?> if ($title == 'Contributors') { //get_levy_contributors(); } ?>