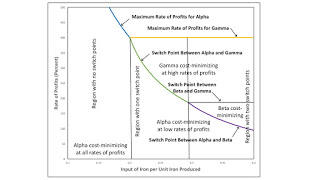
Figure 1: Bifurcation Diagram1.0 Introduction This post continues my exploration of the variation in the number and "perversity" of switch points in a model of prices of production. This post presents a case in which one switch point replaces two switch points on the wage frontier. 2.0 Technology The example in this post is one of an economy in which four commodities can be produced. These commodities are called iron, steel, copper, and corn. The managers of firms know (Table 1) of one process for producing each of the first three commodities. These processes exhibit Constant Returns to Scale. Each column specifies the inputs required to produce a unit output for the corresponding industry. Variations in the parameter d can result in different switch points appearing on the
Topics:
Robert Vienneau considers the following as important: Example in Mathematical Economics, Sraffa Effects
This could be interesting, too:
Robert Vienneau writes Austrian Capital Theory And Triple-Switching In The Corn-Tractor Model
Robert Vienneau writes Double Fluke Cases For Triple-Switching In The Corn-Tractor Model
Robert Vienneau writes The Emergence of Triple Switching and the Rarity of Reswitching Explained
Robert Vienneau writes Recap For A Triple -Switching Example

|
| Figure 1: Bifurcation Diagram |
This post continues my exploration of the variation in the number and "perversity" of switch points in a model of prices of production. This post presents a case in which one switch point replaces two switch points on the wage frontier.
2.0 TechnologyThe example in this post is one of an economy in which four commodities can be produced. These commodities are called iron, steel, copper, and corn. The managers of firms know (Table 1) of one process for producing each of the first three commodities. These processes exhibit Constant Returns to Scale. Each column specifies the inputs required to produce a unit output for the corresponding industry. Variations in the parameter d can result in different switch points appearing on the frontier. Each process requires a year to complete and uses up all of its inputs in that year. There is no fixed capital.
| Input | Industry | ||
| Iron | Steel | Copper | |
| Labor | 1/2 | 1 | 3/2 |
| Iron | d | 0 | 0 |
| Steel | 0 | 1/4 | 0 |
| Copper | 0 | 0 | 1/5 |
| Corn | 0 | 0 | 0 |
Three processes are known for producing corn (Table 2). As usual, these processes exhibit CRS. And each column specifies inputs needed to produce a unit of corn with that process.
| Input | Process | ||
| Alpha | Beta | Gamma | |
| Labor | 1/2 | 1 | 3/2 |
| Iron | 1/3 | 0 | 0 |
| Steel | 0 | 1/4 | 0 |
| Copper | 0 | 0 | 1/5 |
| Corn | 0 | 0 | 0 |
Four techniques are available for producing a net output of a unit of corn. The Alpha technique consists of the iron-producing process and the Alpha corn-producing process. The Beta technique consists of the steel-producing process and the Beta process. The Gamma technique consists of the remaining two processes.
As usual, the choice of technique is based on cost-minimization. Consider prices of production, which are stationary prices that allow the economy to be reproduced. A wage curve, showing a tradeoff between wages and the rate of profits, is associated with each technique. In drawing such a curve, I assume that a bushel corn is the numeraire and that labor is advanced. Wages are paid out of the surplus product at the end of the year. The chosen technique, for, say, a given wage, maximizes the rate of profits. The wage curve for the cost-minizing technique at the given wage lies on the outer frontier formed from all wage curves.
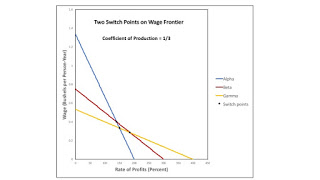
3.0 Result of Technical ProgressFigure 2 shows wage curves when d is 1/3, a fairly high value in this analysis. The wage curves for all three techniques are on the frontier. For certain ranges of the rate of profits, each technique is cost-minimizing. The switch point between the Alpha and Gamma techniques is not on the frontier. No infinitesimal variation in the rate of profits will result in a transition from a position in which the Alpha technique is cost-minimizing in the long period to one in which the Gamma technique is cost-minimizing.

|
| Figure 2: Two Switch Points on Frontier |
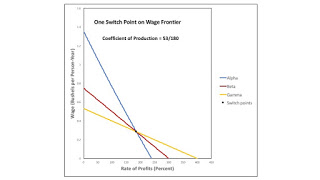
Suppose technical progress reduces d to 53/180. Figure 3 shows the resulting configuration of the wage curves. There is a single switch point, in which all three wage curves intersect. Aside from the switch point, the Beta technique is no longer cost-minimizing for any other rate of profits.

|
| Figure 3: One Switch Point on Frontier |
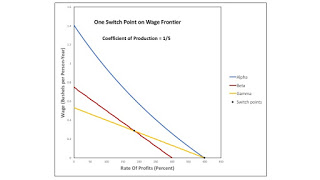
Figure 4 shows the wage curves when the parameter d has been reduced to 1/5. For d between 53/180 and 1/5, the wage frontier is constructed from the wage curves for the Alpha and Gamma techniques. The Beta technique is never cost minimizing, and the switch point between the Beta and Gamma techniques does not lie on the frontier. The wage curves for the Alpha and Beta techniques have an intersection in the first quadrant only for part of that range for the parameter d. That intersection, however, is never on the frontier for that range. For a value of d less than 1/5, the Alpha technique is dominant. The Beta and Gamma techniques are no longer cost minimizing for any rate of profits.

|
| Figure 4: Bifurcation in which Switch Point on Frontier Disappears |
Figure 1, at the top of the post, summarizes the example. Technical progress can result in a change of the number of switch points, where those switch points disappear and appear along the inside of the wage frontier. Bifurcations need not be across the axes for the wage or the rate of profits.
 Heterodox
