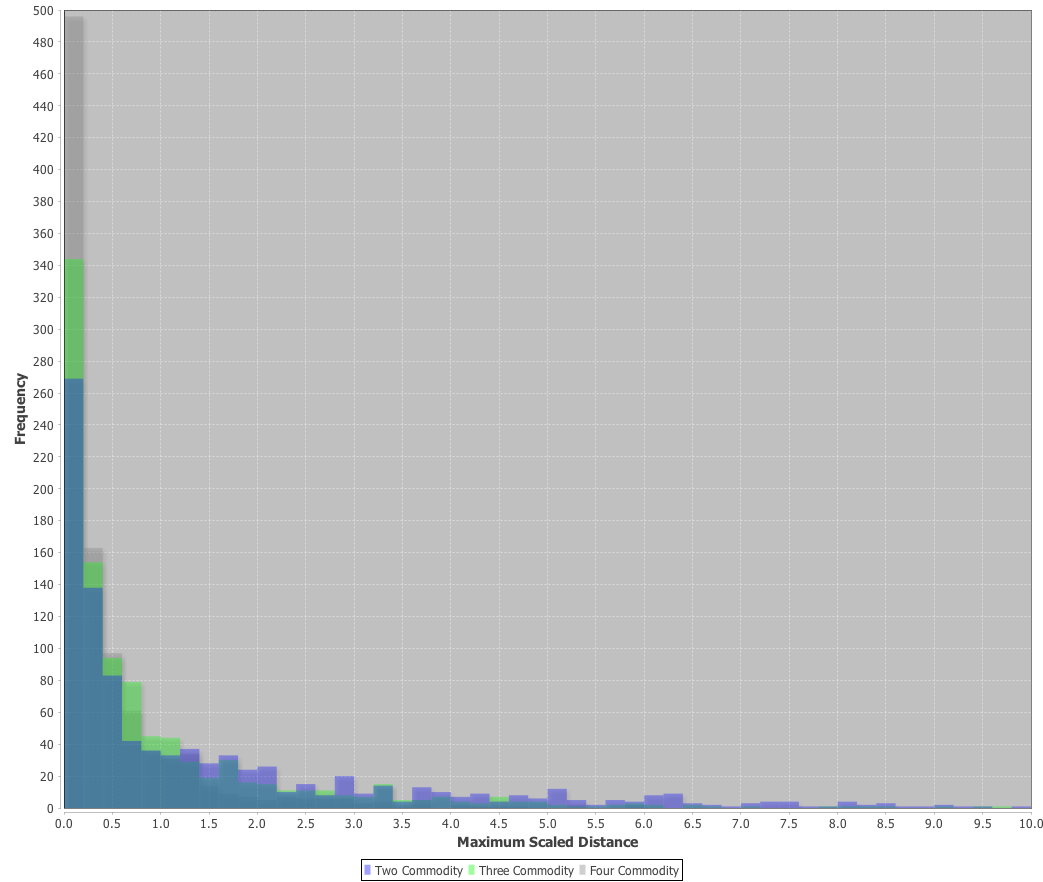
Figure 1: Blowup of Distribution of Maximum Distance of Frontier from Straight Line1.0 Introduction This post is the third in a series. Here is the first, and here is the second. In this post, I am concerned with the probability that price Wicksell effects for a given technique are negative, positive, or both (for different rates of profits). A price Wicksell effect shows the change in the value of capital goods, for different rates of profits, for a technique. If a (non-zero) price Wicksell effect exists, for some range(s) of the rate of profits in which the technique is cost-minimizing, the rate of profits is unequal to the marginal product of capital, in the most straightforward sense. (This is the general case.) Furthermore, a positive price Wicksell effect shows that firms, in a
Topics:
Robert Vienneau considers the following as important: Example in Mathematical Economics, Sraffa Effects
This could be interesting, too:
Robert Vienneau writes Austrian Capital Theory And Triple-Switching In The Corn-Tractor Model
Robert Vienneau writes Double Fluke Cases For Triple-Switching In The Corn-Tractor Model
Robert Vienneau writes The Emergence of Triple Switching and the Rarity of Reswitching Explained
Robert Vienneau writes Recap For A Triple -Switching Example
|
| Figure 1: Blowup of Distribution of Maximum Distance of Frontier from Straight Line |
This post is the third in a series. Here is the first, and here is the second.
In this post, I am concerned with the probability that price Wicksell effects for a given technique are negative, positive, or both (for different rates of profits). A price Wicksell effect shows the change in the value of capital goods, for different rates of profits, for a technique. If a (non-zero) price Wicksell effect exists, for some range(s) of the rate of profits in which the technique is cost-minimizing, the rate of profits is unequal to the marginal product of capital, in the most straightforward sense. (This is the general case.) Furthermore, a positive price Wicksell effect shows that firms, in a comparison of stationary states, will want to employ more capital per person-hour at a higher rate of profits. The rate of profits is not a scarcity index, for some commodity called "capital", limited in supply.
My analysis is successful, in that I am able to calculate probabilities for the specific model of random economies. And I see that an appreciable probability exists that price Wicksell effects are positive. However, I wanted to find a visually appealing example of a wage frontier that exhibits both negative and positive Wicksell effects. The curve I end up with is close enough to an affine function that I doubt you can readily see the change in curvature.
Bertram Schefold has an explanation of this, based on the theory of random matrices. If the Leontief input-output matrix is random, in his sense (which matches my approach), the standard commodity will tend to contain all commodities in the same proportion, that is, proportional to a vector containing unity for all elements. And I randomly generate a numeraire (and net output vector) that will tend to be the same. So my random economies tend to deviate only slightly from standard proportions. And this deviation is smaller, the larger the number of commodities produced. So this post is, in some sense, an empirical validation of Schefold's findings.
2.0 Simulating Random EconomiesThe analysis in this post is based on an analysis, for economies that produce a specified number of commodities, of a specified sample size of random economies (Table 1).
| Seed for Random Generator | Number of Commodities |
Number of Economies |
| 66,965 | 2 | 2,020 |
| 775,545 | 3 | 20,458 |
| 586,658 | 4 | 2,747,934 |
Each random economy is characterized by a Constant-Returns-to-Scale (CRS) technique, a numerate basket, and net output. The technique is specified by a:
- A row vector of labor coefficients, where each element is the person-years of labor needed to a unit output of the numbered commodity.
- A square Leontief input-output matrix, where each element is the units of input of the row commodity needed as input to produce a unit of the column commodity.
The numeraire and net output are column vectors. Net output is set to be the numeraire. The elements of the vector of labor coefficients, the Leontief matrix, and the numeraire are each realizations of independent and identically distributed random variables, uniformly distributed on the unit interval (from zero to one). Non-viable economies are discarded. So, as shown in the table above, more economies are randomly generated than the specified sample size (1,000).
I am treating both viability and the net output differently from Stefano Zambelli's approach. He bases net output on a given numeraire value of net output. Many vectors can result in the same value of net output in a Sraffa model. He chooses the vector for which the value of capital goods is minimized. This approach fits with Zambell's concentration on the aggregate production function.
3.0 Price Wicksell EffectsTable 2 shows my results. As I understand it, the probability that a wage curve for a random economy, in which more than one commodity is produced, will be a straight line is zero. And I find no cases of an affine function for the wage curve, in which the maximum wage (for a rate of profits of zero) and the maximum rate of profits (for a wage of zero) are connected by a straight line in the rate of profits-wage space.
| Number of Industries | Number w/ Negative Price Wicksell Effects |
Number w/ Positive Price Wicksell Effects | Number w/ Both Price Wicksell Effects |
| 2 | 548 | 452 | 0 |
| 3 | 603 | 416 | 19 |
| 4 | 679 | 334 | 13 |
The wage curve in a two-commodity economy must be of a single curvature. So for a random economy in which two commodities are produced, price Wicksell effects are always negative or always positive, but never both. And that is what I find. I also find a small number of random economies, in which three or four commodities are produced, in which the wage curve has varying curvature through the economically-relevant range in the first quadrant.
4.0 Distribution of Displacement from Affine FrontierI also measured how far, in some sense, these wage curves for random economies are from a straight line. I took the affine function, described above, connecting the intercepts, of the wage curve, with the rate of profits and the wage axes as a baseline. And I measured there absolute vertical distance between the wage curve and this affine function. (My code actually measures this distance at 600 points). I scale the maximum of this absolute distance by the maximum wage. Figure 1, above, graphs histograms of this scaled absolute vertical distance, expressed as a percentage. Tables 3 and 4 provide descriptive statistics for the empirical probability distribution.
| Number of Produced Commodities | |||||
| Two | Three | Four | |||
| Sample Size | 1,000 | 1,000 | 1,000 | ||
| Mean | 1.962 | 1.025 | 0.498 | ||
| Std. Dev. | 3.428 | 1.773 | 0.772 | ||
| Skewness | 5.111 | 4.837 | 3.150 | ||
| Kurtosis | 48.467 | 38.230 | 12.492 | ||
| Coef. of Var. | 0.5724 | 0.578 | 0.645 | ||
| Number of Produced Commodities | |||||
| Two | Three | Four | |||
| Minimum | 0.00018 | 0.000251 | 0.0000404 | ||
| 1st Quartile | 0.179 | 0.114 | 0.0608 | ||
| Median | 0.653 | 0.402 | 0.203 | ||
| 3rd Quartile | 2.211 | 1.120 | 0.583 | ||
| Maximum | 50.613 | 23.374 | 5.910 | ||
| IQR/Median | 3.110 | 2.504 | 2.574 | ||
We see that the wage curves for these random economies tend not to deviate much from an affine function. And, as more commodities are produced, this deviation is less.
5.0 An ExampleFor three commodity economies, the maximum scaled displacement of the wage curve from a straight line I find is 23.4 percent. But, of those three-commodity economies with both negative and positive price Wicksell effects, the maximum displacement is only 0.736 percent. Table 5 provides the randomly generated parameters for this example.
| Input | Corn Industry | Pigs Industry | Ale Industry | Net Output |
| Corn | 0.5525152 | 0.0024860 | 0.2652761 | 0.26077 |
| Pigs | 0.5164675 | 0.7469286 | 0.1128406 | 0.42705 |
| Ale | 0.5636308 | 0.0368399 | 0.2110545 | 0.98691 |
| Labor | 0.799364 | 0.028111 | 0.012866 |
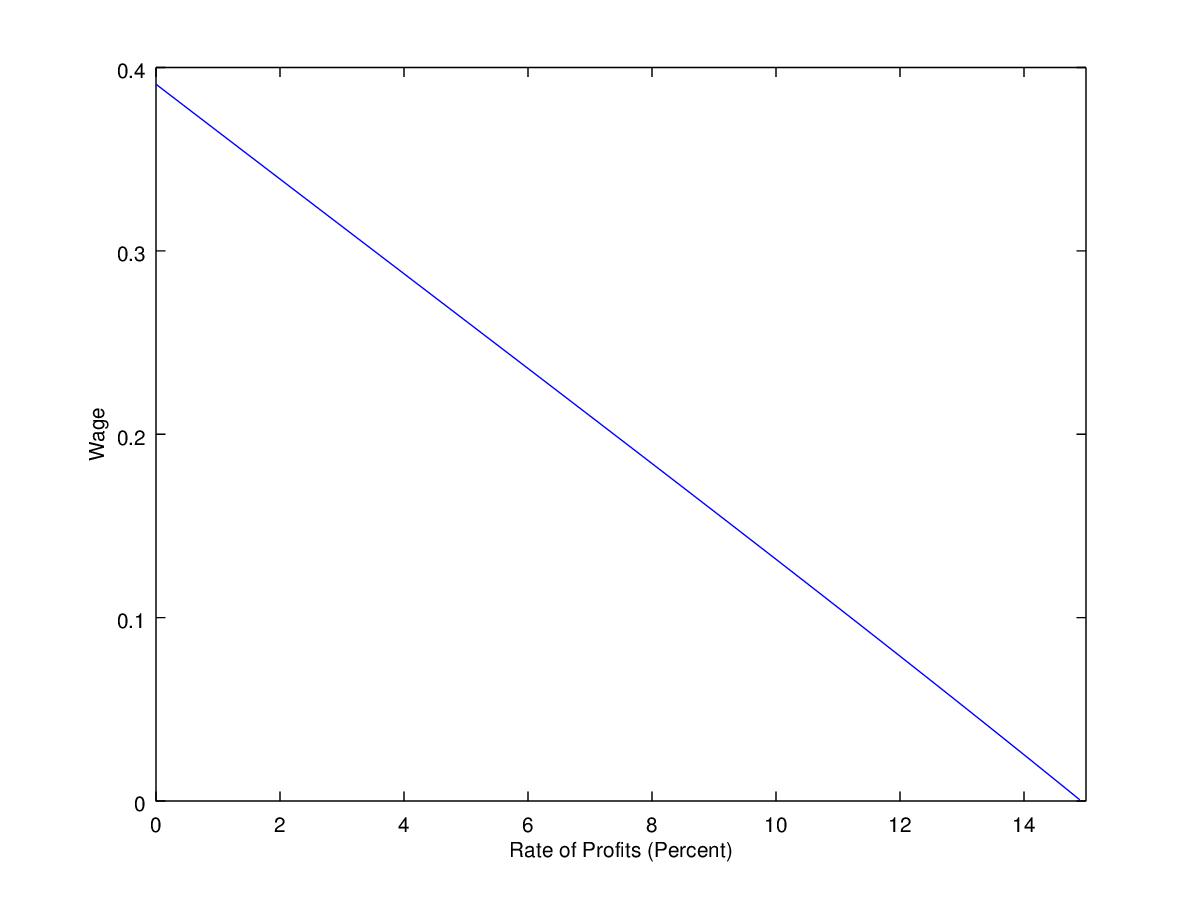
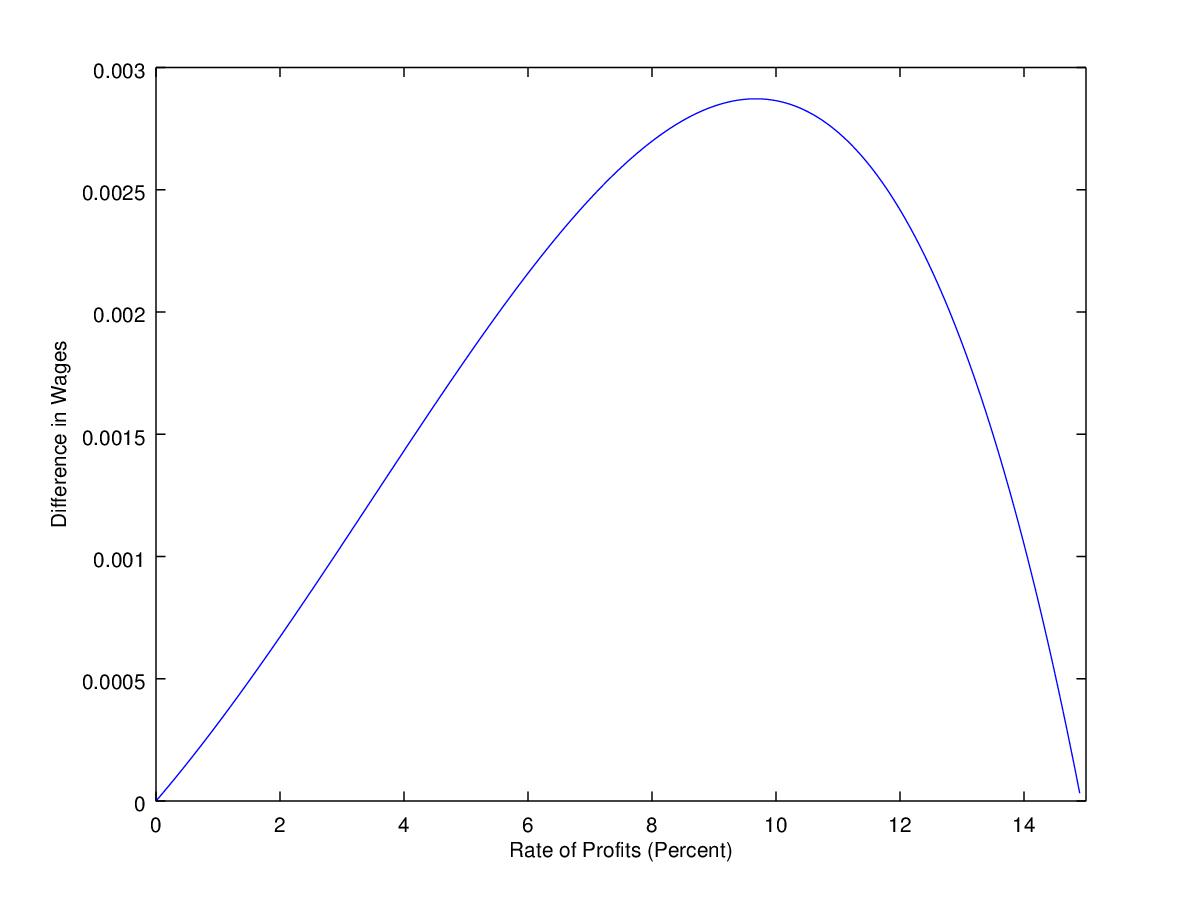
Figure 2 shows the wage curve for the example. This curve is not a straight line, no matter how close it may appear so to the eye. Figure 3 shows the distance between the wage curve and a straight line. Notice that the convexity towards the left of the curve in Figure 3 varies slightly from the convexity for the rest of the graph. This is a manifestation of price Wicksell effects in both directions. (I need to perform some more checks on my program.)
|
| Figure 2: A Wage Frontier with Both Negative and Positive Price Wicksell Effects |
|
| Figure 3: Vertical Distance of Frontier from Straight Line |
I hope Bertram Schefold and Stefano Zambelli are aware of each other's work.
Postscript: I had almost finished this post before Stefano Zambelli left this comment. I'd like to hear from him at [email protected].
References- Bertram Schefold (2013). Approximate Surrogate Production Functions. Cambridge Journal of Economics.
- Stefano Zambelli (2004). The 40% neoclassical aggregate theory of production. Cambridge Journal of Economics 28(1): pp. 99-120.