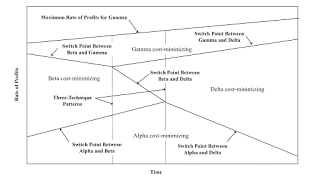
Figure 1: One Way One Technique Can Replace Another The wage-rate of profits frontier (or wage frontier) is calculated with prices of production, given the techniques of production, available in the economy, for producing a given output. Suppose at one point in time, the techniques that lie along the wage frontier consist of the Alpha, Beta, and Gamma techniques, in order of an increasing rate of profits. As time passes, technical innovation alters coefficients of production, including for techniques that were not on the wage frontier at the initial point in time. Suppose at a later point in time, the techniques along the wage frontier now consist of the Alpha, Delta, and Gamma techniques. How did this replacement of the Beta technique by the Delta technique occur? What happened in the
Topics:
Robert Vienneau considers the following as important: Example in Mathematical Economics, Sraffa Effects
This could be interesting, too:
Robert Vienneau writes Austrian Capital Theory And Triple-Switching In The Corn-Tractor Model
Robert Vienneau writes Double Fluke Cases For Triple-Switching In The Corn-Tractor Model
Robert Vienneau writes The Emergence of Triple Switching and the Rarity of Reswitching Explained
Robert Vienneau writes Recap For A Triple -Switching Example

|
| Figure 1: One Way One Technique Can Replace Another |
The wage-rate of profits frontier (or wage frontier) is calculated with prices of production, given the techniques of production, available in the economy, for producing a given output. Suppose at one point in time, the techniques that lie along the wage frontier consist of the Alpha, Beta, and Gamma techniques, in order of an increasing rate of profits. As time passes, technical innovation alters coefficients of production, including for techniques that were not on the wage frontier at the initial point in time. Suppose at a later point in time, the techniques along the wage frontier now consist of the Alpha, Delta, and Gamma techniques. How did this replacement of the Beta technique by the Delta technique occur? What happened in the intervening time interval?
The pattern analysis I have been developing suggests answers to these questions. A pattern is a qualitative characterization of a part of the wage frontier associated with a change of switch points. And the patterns I have identified suggest three possibilities for the postulated change in techniques.
Figure 1, above, illustrates the first possibility. These illustrations are only schematic; the illustrated curves need not be straight lines. In the first pattern, two three-technique patterns succeed one another in time. A three-technique pattern arises when a switch point on the frontier is an intersection of the wage curves for three techniques. For the temporally first three-technique pattern, a switch point is replaced by two switch points, with a new technique being cost-minimizing for rates of profits between the two switch points. Four techniques, instead of three techniques, now lie on the wage frontier. For the later three-technique pattern, two switch points are replaced by one switch point. The middle technique at the original point in time is no longer cost-minimizing, for any rate of profits. The postulated initial sequence of techniques occurs before the first pattern, and the final sequence occurs after the second pattern.
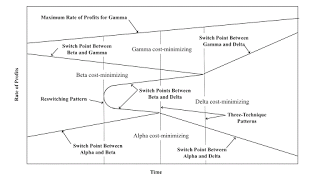
A second possibility is that a reswitching pattern is followed by two three-technique patterns. (The shape of the curves are definitely off in Figure 2.) For the reswitching pattern, a new switch point occurs at which the wage curves for two techniques are tangent. For some time afterwards, this possibility is a case of reswitching. The two three-technique patterns remove the wage curve for the originally middle technique from the wage frontier. Once again, the postulated observations for the first and last point in time are consistent with this story.

|
| Figure 2: A Second Way One Technique Can Replace Another |
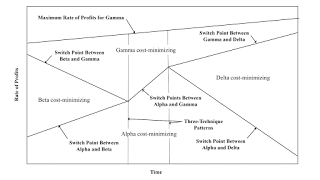
A third possibility (Figure 3) also involves a sequence of two three-technique patterns. In this case, the temporally first three-technique pattern removes the wage-curve for the middle technique from the wage frontier. The wage frontier now has a succession of two cost-minimizing techniques along it. The second three-technique pattern puts a new technique in the middle of the wage frontier.

|
| Figure 3: A Third Way One Technique Can Replace Another |
Two other stories can arise out of symmetries of, at least, the first and second possibility. And one might complicate the story by superimposing wage curves for other techniques somewhere in this story. In my exploration of numerical examples, I have usually found the switch points in reswitching examples disappearing with patterns over the axis for the rate of profits and the wage axis. That is not the case here.
I think that wage curves can be calculated from Leontief matrices, as derived from the National Income and Product Accounts (NIPA). Zonghie Han & Bertram Schefold and Stefano Zambelli have calculated wage frontiers from empirical data. But I think confirming these stories of technical change fit data is a challenge for those who know more about empirical research following on from Leontief's work. I suspect one would have to look at stylized facts, in some sense. I think I have been developing a perspective on technical innovation that would be worth exploring for empirical applications, even if I am not the one to do this.
 Heterodox
