Figure 1: Prices of Production1.0 Introduction This post presents a new kind of fluke case in the analysis of the choice of technique, at least new to me. I call this a pattern for requirements for use, and it can arise only in a case of joint production. My graphs in this post have some incomprehensible notation, since I am currently exploring perturbing parameters, in line with my research agenda. I know that perturbing the requirements for use removes the indeterminancy in this example. 2.0 The Givens For this example, the data consist of the available technology and the proportions in which the two produced commodities, corn and silk, enter into the commodity basket specified by the requirements for use. I also choose a numeraire. The example is a perturbation of problem 8.2 in
Topics:
Robert Vienneau considers the following as important: Example in Mathematical Economics, Joint Production
This could be interesting, too:
Robert Vienneau writes Austrian Capital Theory And Triple-Switching In The Corn-Tractor Model
Robert Vienneau writes Double Fluke Cases For Triple-Switching In The Corn-Tractor Model
Robert Vienneau writes The Emergence of Triple Switching and the Rarity of Reswitching Explained
Robert Vienneau writes Recap For A Triple -Switching Example
| Figure 1: Prices of Production |
This post presents a new kind of fluke case in the analysis of the choice of technique, at least new to me. I call this a pattern for requirements for use, and it can arise only in a case of joint production. My graphs in this post have some incomprehensible notation, since I am currently exploring perturbing parameters, in line with my research agenda. I know that perturbing the requirements for use removes the indeterminancy in this example.
2.0 The GivensFor this example, the data consist of the available technology and the proportions in which the two produced commodities, corn and silk, enter into the commodity basket specified by the requirements for use. I also choose a numeraire. The example is a perturbation of problem 8.2 in Kurz and Salvadori (1995).
Table 1 specifies a constant returns-to-scale technology. In each of three processes known to managers of firms at a given time, laborers work with inputs of corn and silk to produce outputs of corn, silk, or both. The inputs are completely used up in producing the output, and all three processes are assumed to take a year to complete. Since two commodities are produced in this numerical example, a technique consists of at most two processes. Table 2 lists the techniques and the processes corresponding to each technique.
| Input | Process | ||
| I | II | III | |
| Labor | 1 Person-Yr. | 1 Person-Yrs | (e/16) Person-Yr. |
| Corn | 1 Bushel | 1 Bushel | 1 Bushel |
| Silk | 1 Sq. Meter | 1 Sq. Meter | 1 Sq. Meter |
| Output | |||
| Corn | 3 Bushels | 5 Bushels | 0 Bushel |
| Silk | 3 Sq. Meters | 0 Sq. Meter | 5 Sq. Meters |
| Technique | Proceses | |
| Alpha | (I), (II) | |
| Beta | (I), (III) | |
| Gamma | (II), (III) | |
| Delta | (I) | |
| Epsilon | (II) | |
| Zeta | (III) | |
The requirements for use are such that equal quantities of corn and silk are required. The numeraire consists of a commodity basket of one bushel corn and one square meter of silk.
3.0 Quantity FlowsWhich techniques can satisfy the requirements for use? Suppose, contrary to the specification, that requirements for use specified that more bushels of corn be supplied than square meters of silk. The Alpha technique technique could satisfy these requirements for use, with Process I and Process II both being operated at a positive level of operations. As the requirements for corn declined, the relative level of operation of Process II would decline. The Alpha technique satisfies the given requirements for use with Process II operated at a level of zero. This is a corner case in which Process II still contributes an equation to the price system.
By a symmetric argument, the Beta technique can also satisfy the requirements for use. Process III is operated at a level of zero in the Beta techniquye.
The Gamma technique can satisfy any composition of the requirements of use, as in the theory of single production. So it can satisfy the requirements for use in this case, too.
The Delta technique can satisfy any requirements for use, as well. However, when the requirements for use specify an unequal number of bushels corn and square meters of silk, one commodity is in excess supply and its price of production is zero.
Neither the Epsilon nor the Zeta technique can satisfy the requirements for use when the net output must contain a positive quantity of both commodities.
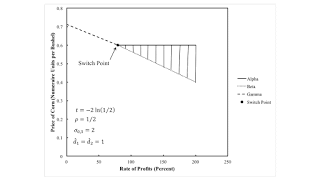
4.0 Prices of ProductionBut being feasible, in the sense that a technique can satisfy the requirements for use, is not sufficient for a technique to be cost-minimizing. Prices of production must be considered, as in models of the production of commodities with single production. Prices of production vary with distribution and the technique. Figure 1, at the top of this post, graphs the price of corn for the three techniques which contribute two equations, in addition to the equation specifying the numeraire, to determine the four price variables (price of corn, price of silk, the wage, and the rate of profits).
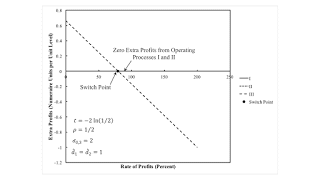
4.1 The Alpha TechniqueSuppose the Alpha technique is in operation. The wage can range from zero to two numeraire units per person-year. Figure 2 shows that the Alpha technique is not cost-minimizing at low rates of profits, but is cost-minimizing at high rates of profits. If, at low rates of profits, Process III replaces I, the Gamma technique will be adopted. If it replaces Process II, the Beta technique is adopted. But the Beta technique is not cost-minimizing at low rates of profits. (In a model of single production, it is unambiguous which process is replaced when a new process is introduced into a technique.)
| Figure 2: Extra Profits with Prices for the Alpha Technique |
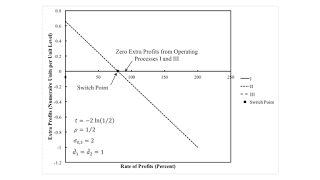
On the contrary, suppose the Beta technique is in operation. Figure 3 shows that this technique is cost-minimizing only at high rates of profits. At low rates of profits, firms will have an incentive to operate Process II. If they replace Process III by Process II, firms will be operating the Alpha technique. The above analysis has shown that the Alpha technique would not be cost-minimizing in this range of the rate of profits. If Process I is replaced by Process II, firms would be operating the Gamma technique.
| Figure 3: Extra Profits with Prices for the Beta Technique |
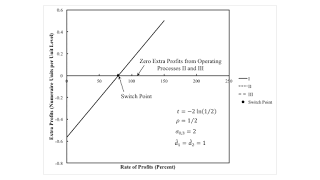
The Gamma technique is cost-minimizing at low rates of profits. Figure 4 shows extra profits for prices for the Gamma technique. Both the Alpha and the Beta technique are cost-minimizing at high rates of profits. Extra profits can be made in operating Process I at Gamma prices for high rates of profits. Firms would find it profitable to replace either Process III or Process II, resulting in either the Alpha or the Beta technique, respectively.
| Figure 4: Extra Profits with Prices for the Gamma Technique |
I am going to present the Delta technique in more detail. For Process I to neither make extra profits nor to incur extra costs, the following equality must obtain.
(p1 + p2)(1 + r) + w = 3 p1 + 3 p2
The specification of the numeraire yields the following equation:
p1 + p2 = 1
For the Delta technique to be cost-minimizing, the two equations above must hold, extra profits must not be obtainable in operating Process II, and extra profits must not be obtainable in operating Process III.
Prices drop out of the equation arising out of the requirement that Process I neither obtains extra profits nor incurrs extra costs. The wage is an affine function of the rate of profits:
w = 2 - r
The above wage curve is identical with the wage curves for the Alpha and the Beta techniques.
For the Delta technique to be cost-minimizing, firms must not be able to obtain extra profits in operating Process II. This condition yields an inequality:
p1 ≤ 1 + r + w
Substituting the wage curve and re-arranging terms yields an upper bound on the price of corn:
p1 ≤ 3/5
That is, the price of corn cannot exceed the price of corn falling out of the Alpha technique. This inequality is shown by the upper bound of the shaded region in Figure 1 at the top of this post.
The condition that firms cannot obtain extra profits in operating Process III also yields an inequality:
p2 ≤ 1 + r + (e/16) w
Or the price of corn cannot fall below a lower bound:
(1/80)[64 - 2 e - (16 - e)r ≤ p1
This inequality is shown by the lower bound of the shaded region in Figure 1.
The Delta technique can be consistent with cost-minimizing for any price of corn in the shaded region, including the boundaries. The two constraints combined impose a lower bound of the rate of profits:
[2 (8 - e)]/(16 - e) ≤ r
The lower bound on the rate of profits is the rate of profits at the switch point.
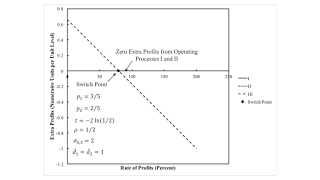
As with the Alpha, Beta, and Gamma techniques, one can plot extra profits versus the rate of profits for all processes, given the price system for the Delta technique. Since the Delta technique has an extra degree of freedom, one must choose a price, as well as, say, the rate of profits for such an analysis. Figure 5 shows such a graph for a price of corn of 3/5 numeraire units per bushel. The switch point here is at the same rate of profits as for the switch point shown in Figures 2 and 3. For rates of profits below the switch point, firms will want to adopt the Gamma technique. For rates of profits above the switch point, the Delta technique is cost-minimizing, but not uniquely so. Firms would also be willing to adopt the Alpha technique.
| Figure 5: Extra Profits with One Set of Prices for Delta |
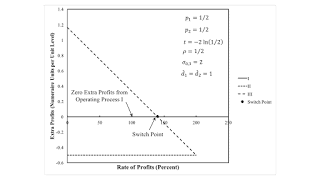
But suppose the price of corn happens to be 1/2 numeraire units per bushel. Figure 6 plots extra profits in the three processes against the rate of profits. Firms will no longer be willing to choose to operate Process II along side Process I for some distribution of income. Costs exceed revenues for Process II, whatever the rate of profits.
| Figure 6: Extra Profits with Another Set of Prices for Delta |
For low rates of profits, the Delta technique is not cost-minimizing; firms will want to adopt the Beta technique. The "switch point" in Figure 6 is to the right of the switch point shown in all the other graphs in this post. From Figure 3, we know the adoption of the Beta technique is not the end of the story if the rate of profits lies below the rate of profits in the original switch point. For rates of profits between the two "switch points", prices must adjust until no extra profits can be obtained by operating the Beta technique. For rates of profits above the new "switch point", the Delta technique is uniquely cost minimizing at these prices and distribution of income. The Beta and Delta techniques are both cost-minimizing only at the new "switch point".
4.5 SummaryI find the possibilities in joint production confusing. I am fairly convinced of the above analysis, but I would not be surprised if my exposition could be improved. Anyway, here is a summary of the analysis of the choice of technique for this numerical example:
- When the rate of profits is smaller than the rate of profits at the switch point (or, equivalently, the wage is greater than the wage at the switch point), the Gamma technique is uniquely cost-minimizing. Prices are determined, given, say, the wage.
- When the rate of profits is larger than the rate of profits at the switch point (or the wage is lower than the wage at the switch point), the Alpha, Beta, and Delta techniques can all be cost-minimizing. Prices are indeterminate, with the price of corn confined to lie in the limits shown in Figure 1 by the curves for the Alpha and Beta techniques. Processes II and III in the technology are each operated at a level of zero, whatever the technique.
- When the rate of profits and the wage are as at the switch point, the Alpha, Beta, Gamma, or Delta technique are all cost-minimizing. Prices are determined, with a bushel corn priced at 3/5 numeraire units and a square meter of silk at 2/5 numeraire units.
This is a fluke case. If the proportions in which corn and silk enter into the commodity basket specified by requirements for use are varied at all, the indeterminancy of prices associated with a low wage vanishes. If bushels of corn exceeds square meters of silk in requirements for use, the Alpha and Gamma techniques are feasible. The Beta technique cannot satisfy the requirements for use. The Delta technique can satisfy the requirements for use, with an excess supply of silk at a price of zero. But then extra profits would be available by operating the second process. So only the Alpha or Gamma technique would be cost-minimizing, depending on income distribution.
 Heterodox

