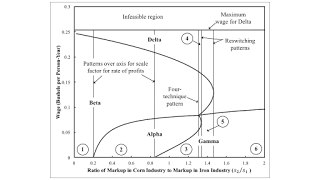
Figure 1: A Pattern Diagram This post illustrates the numeric example used here. The example is of an economy in which two commodities, iron and corn, are produced by workers from inputs of iron and corn. Two processes are available for each industry, leading to a choice among four techniques. I analyze stationary states. I look at prices of production, with a bushel corn as numeraire and wages paid out of the surplus at the end of the year. Prices of production are defined so as to allow for markups in both industries. Figure 1 shows the variation in switch points on the wage frontier with variations in the ratio of markups. I am interested in how variations in markups can bring about qualitative changes favorable to labor pressing for higher wages. For example, around the switch
Topics:
Robert Vienneau considers the following as important: Example in Mathematical Economics, Full Cost Prices, Sraffa Effects
This could be interesting, too:
Robert Vienneau writes Austrian Capital Theory And Triple-Switching In The Corn-Tractor Model
Robert Vienneau writes Double Fluke Cases For Triple-Switching In The Corn-Tractor Model
Robert Vienneau writes The Emergence of Triple Switching and the Rarity of Reswitching Explained
Robert Vienneau writes Recap For A Triple -Switching Example
| Figure 1: A Pattern Diagram |
This post illustrates the numeric example used here. The example is of an economy in which two commodities, iron and corn, are produced by workers from inputs of iron and corn. Two processes are available for each industry, leading to a choice among four techniques. I analyze stationary states.
I look at prices of production, with a bushel corn as numeraire and wages paid out of the surplus at the end of the year. Prices of production are defined so as to allow for markups in both industries. Figure 1 shows the variation in switch points on the wage frontier with variations in the ratio of markups.
I am interested in how variations in markups can bring about qualitative changes favorable to labor pressing for higher wages. For example, around the switch point between Alpha and Gamma in Region 3 and at the lower wage for such a switch point in Region 4, a higher wage is associated with firms wanting to hire more workers, given the level of net output of corn.
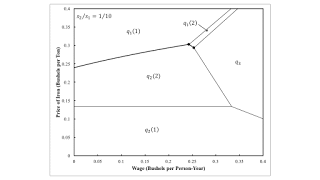
| Figure 2: The Solution of the LP in Region 1 |
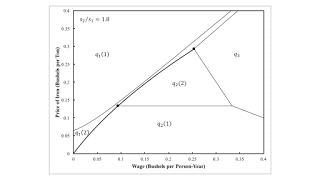
I analyze the choice of technique by analyzing the solution of a linear program for a cost-minimizing firm. Figure 2 illustrates. (I have this figure wrong in my working paper.) Above the heavy locus, firms are willing to only produce iron. The regions in which profit-maximizing firms are willing to adopt each iron-producing process are indicated. Below the heavy locus, firms are only willing to produce corn. This region is also partitioned by the two corn-producing process.
Firms are willing to produce both iron and corn only along the heavy locus. The economy is capable of being reproduced only with the indicated combination of wages and prices. This is how the wage frontier appears in this space.
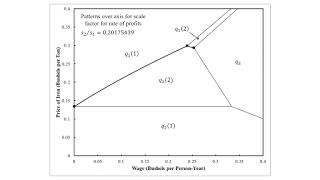
| Figure 3: A Pattern over the Axis for the Scale Factor for the Rate of Profits |
Figure 3 illustrates the solution to the LP with a higher markup in corn production or a smaller markup in iron production. For a wage of zero, firms are indifferent about the choice of the corn-producing process when prices are such that the economy can be reproduced. Figure 4 shows the case in which relative markups are such that firms are indifferent between the two iron-producing processes at a wage of zero.
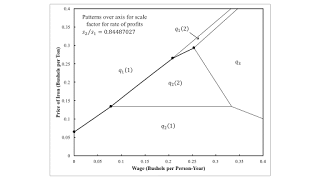
| Figure 4: Another Pattern over the Axis for the Scale Factor for the Rate of Profits |
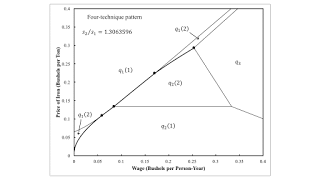
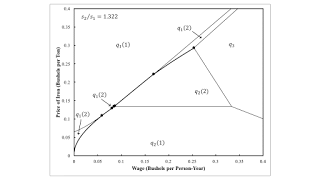
Figure 4 shows a curious case. Consider the point where firms are willing to operate the first iron-producing process and both of the corn-producing processes. At this combination of the wage and prices, firms are also willing to operate the second iron-producing process. This is a bit more obvious by examining Figures 5 and 6, which are for a slightly higher ratio of the markup in corn production to the markup in iron production. The region in which firms are willing to operate only the second iron-producing process has split up into three subregions. Figure 4 arises for a ratio of markups where the middle subregion is just emerging.
| Figure 5: A Four-Technique Pattern |
| Figure 6: The Solution of the LP in Region 4 |
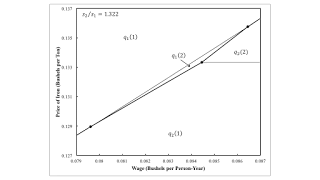
| Figure 7: An Enlargement in Region 4 |
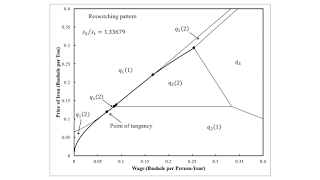
Figure 8 illustrates the ratio of markups in which the first and second of the three subregions, in which the firm is only willing to operate the second iron-producing processes are just merging. The middle subregion is such a sliver that it is not really visible on the graph.
| Figure 8: A Reswitching Pattern |
For the ratio of markups illustrated in Figure 9, firms are willing to operate the second-iron producing process all along the heavy locus. When prices are such that economy can be reproduced, they are willing to operate the first iron-producing process only at the indicated tangent point.
| Figure 9: Another Reswitching Pattern |
Figure 10 illustrates the solution to the LP for a ratio of markups in right-most region in Figure 1. Markups in the iron industry are much higher than the markups in the corn industry.
| Figure 10: The Solution of the LP in Region 6 |
These diagrams illustrate, for a numerical example, the whole range of relative markups among industries. Qualitative changes in switch points are indicated. And I have demonstrated that the Cambridge capital controversy has implications for non-competitive markets. Can you find this point being made in the literature on industrial organization?
 Heterodox

