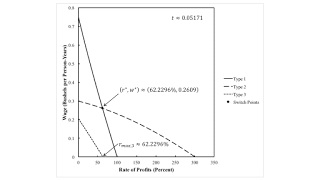
Figure 1: Wage Curves for Fluke Case for r-Order of Fertility1.0 Introduction This post illustrates two fluke cases that can arise in a model with land and extensive rent. I call these a pattern of switch points for the r-order of fertility and a pattern of switch points for the w- order of fertility. I have previously described a fluke case in the order of rentability, which can be either over the wage axis or over the axis for the rate of profits. These fluke cases can arise in an analysis in which a parameter space is partitioned by fluke cases such that in each of the resulting regions the analysis of the choice of technique does not qualitatively vary, in some sense. 2.0 Introduction The technology is described by the coefficients of production in Table 1. Let there be T1 = 100
Topics:
Robert Vienneau considers the following as important: Example in Mathematical Economics, Joint Production, Sraffa Effects
This could be interesting, too:
Robert Vienneau writes Austrian Capital Theory And Triple-Switching In The Corn-Tractor Model
Robert Vienneau writes Double Fluke Cases For Triple-Switching In The Corn-Tractor Model
Robert Vienneau writes The Emergence of Triple Switching and the Rarity of Reswitching Explained
Robert Vienneau writes Recap For A Triple -Switching Example
| Figure 1: Wage Curves for Fluke Case for r-Order of Fertility |
This post illustrates two fluke cases that can arise in a model with land and extensive rent. I call these a pattern of switch points for the r-order of fertility and a pattern of switch points for the w- order of fertility. I have previously described a fluke case in the order of rentability, which can be either over the wage axis or over the axis for the rate of profits. These fluke cases can arise in an analysis in which a parameter space is partitioned by fluke cases such that in each of the resulting regions the analysis of the choice of technique does not qualitatively vary, in some sense.
2.0 IntroductionThe technology is described by the coefficients of production in Table 1. Let there be T1 = 100 acres of type 1 land, T2 = 80 acres of type 2 land, and T3 = 40 acres of type 3 land. See this post for a slightly longer description of the technology.
| Input | Iron Industry | Corn Industry | ||
| I | II | III | IV | |
| Labor | a0,1 = 1 | a0,2 = 1/2 | a0,3 = 3 | a0,4(t) = 2.0743 e-0.03648 t |
| Type 1 Land | 0 | b1,2 = 1 | 0 | 0 |
| Type 2 Land | 0 | 0 | b2,3 = 1 | 0 |
| Type 3 Land | 0 | 0 | 0 | b3,4 = 1 |
| Iron | a1,1 = 0 | a1,2 = 1/2 | a1,3 = 1/8 | a1,4(t) = 0.3551 e-0.06337 t |
| Corn | a2,1 = 1/2 | a2,2 = 0 | a2,3 = 0 | a2,4(t) = 0.3343 e-0.2906 t |
Table 2 lists the techniques for this example. Feasiblity of a technique is determined by requirements for use.
| Technique | Type of Land | ||
| Type 1 | Type 2 | Type 3 | |
| Alpha | Fully farmed | Fully farmed | Partially farmed |
| Beta | Partially farmed | Fully farmed | Fully farmed |
| Gamma | Fully farmed | Partially farmed | Fully farmed |
| Delta | Fully farmed | Partially farmed | Fallow |
| Epsilon | Fully farmed | Fallow | Partially farmed |
| Zeta | Partially farmed | Fully farmed | Fallow |
| Eta | Fallow | Fully farmed | Partially farmed |
| Theta | Partially farmed | Fallow | Fully farmed |
| Iota | Fallow | Partially farmed | Fully farmed |
| Kappaa | Partially farmed | Fallow | Fallow |
| Lambda | Fallow | Partially farmed | Fallow |
| Mu | Fallow | Fallow | Partially farmed |
I start with the assumption that the rate of profits is taken as given. I go through a numerical algorithm to find a particular value of the parameter t. So suppose rent is not paid on a given type of land and that profits, rent, and wages are paid out of the surplus product at the end of the yearly cycle of production. With a bushel corn as numeraire, you can figure out the wage and the price of iron as a function of the rate of profits. And you can get the wage curves shown in Figure 1, at the top of this post.
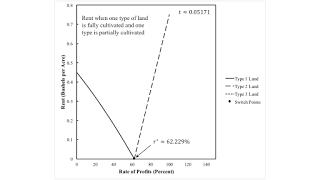
Now suppose requirements for use are such that they can only be satisfied with one type of land totally farmed and a second type partially farmed. Given the rate of profits, one might consider a vertical line in Figure 1. If the rate of profits is less than r*, land of Type 1 will be farmed fully first, and land of Type 2 will only be farmed to the extent that are mandated by requirements for use. That is, the Delta technique will be adopted. On the other hand, for a rate of profit between r* and 100 percent, the Zeta technique will be adopted. Figure 2 shows rents in this case. Only the lands fully cultivated pay a rent.
| Figure 2: Rent for Fluke Case for r-Order of Fertility |
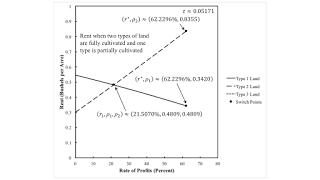
But suppose requirements for use are greater. They can only be satisfied by fully cultivating two types of land and partially cultivating the remaining tye. Then, given the rate of profits, the Alpha technique will be adopted. The rate of profits can only range from zero to r*. The order of fertility, from most fertile lands to least fertile, is Type 1, Type 2, and Type 3.
Figure 3 shows rents in this subcase. For a small rate of profits, the order of fertility matches the order of rentability. Not so much for a higher, feasible rate of profits.
| Figure 3: Rent for Fluke Case for r-Order of Fertility (Cont'd) |
Suppose 'slow time' was to increase, with a consequent reduction in the coefficients of production on Type 3 land, other than for the acres of land needed to produce a bushel corn. The wage curve for Type 3 land in Figure 1 would move outward. A range of high rates of profits would appear in which the Alpha technique is cost-minimizing, but in which the order of fertility is Type 2, Type 1, Type 3 lands. The value of time approximately equal to 0.05171 is an edge case just before, at a range of high rate of profits, an order of fertility appears that matches the order of rentability.
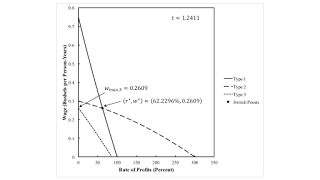
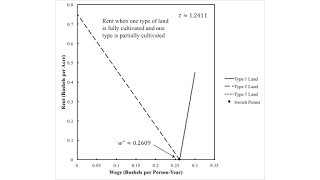
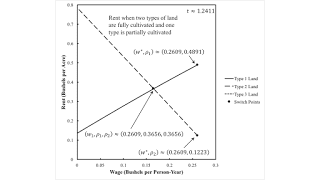
4.0 Fluke Case for the w-Order of Fertility Over the Wage AxisNow suppose instead that the wage is taken as given outside the system of equations for prices of production. I take a time ofapproximately 1.2411 for defining the coefficients of production. I get the wage curves in Figure 4. For a low given wage, the Zeta technique is cost-minimizing. For a high feasible given wage, the Delta technique will be operated. Figure 5 graphs rents. In this subcase, it does not matter if the wage or the rate of profits is taken as given. The story is analogous.
| Figure 4: Wage Curves for Fluke Case for w-Order of Fertility |
| Figure 5: Rents for Fluke Case for w-Order of Fertility |
But suppose requirements for use are such that three types of land must be cultivated, with one only partially cultivated. Then the Alpha technique is cost-minimizing, whatever the wage as long as it is feasible. Figure 6 graphs rents in this case. The order of fertility matches the order of rentability for low wages, but not for high feasible wages. If time were to increase, however, a range for high wages would appear in which the order of fertility matches the order of rentability. Figure 4 illustrates a fluke switch point.
| Figure 6: Rents for Fluke Case for w-Order of Fertility (Cont'd) |
So there are two new fluke switch points, where these flukes arise in models of extensive rent. I keep on thinking I am discovering theoretical possiblities, possibly through sheer bloody-mindedness, that nobody has noted before.
 Heterodox

