Figure 1: Wage Curves and Rent for an Example of Intensive Rent The analysis of the choice of technique has above always been based on the construction of a wage-rate of profits frontier. Given a technology in which requirements for use can be satisfied, prices of production for an eligible technique are uniquely determined by the given rate of profits. If the rate of profits is in a range where such prices are non-negative for at least one technique, one of the techniques is uniquely cost-minimizing, except at switch points. This property does not necessarily hold in models of general joint production. The first subsection of the first non-introductory chapter on joint production in Bidard (2004) has the title "Not amused". An examination of local perturbations in an example of intensive
Topics:
Robert Vienneau considers the following as important: Example in Mathematical Economics, Joint Production, Sraffa Effects
This could be interesting, too:
Robert Vienneau writes Austrian Capital Theory And Triple-Switching In The Corn-Tractor Model
Robert Vienneau writes Double Fluke Cases For Triple-Switching In The Corn-Tractor Model
Robert Vienneau writes The Emergence of Triple Switching and the Rarity of Reswitching Explained
Robert Vienneau writes Recap For A Triple -Switching Example
| Figure 1: Wage Curves and Rent for an Example of Intensive Rent |
The analysis of the choice of technique has above always been based on the construction of a wage-rate of profits frontier. Given a technology in which requirements for use can be satisfied, prices of production for an eligible technique are uniquely determined by the given rate of profits. If the rate of profits is in a range where such prices are non-negative for at least one technique, one of the techniques is uniquely cost-minimizing, except at switch points. This property does not necessarily hold in models of general joint production. The first subsection of the first non-introductory chapter on joint production in Bidard (2004) has the title "Not amused". An examination of local perturbations in an example of intensive rent illustrates surprising possibilities.
Table 1 presents coefficients of production, in which an example from D'Agata (1983) has been extended to include structural economic dynamics. Only one type of land exists, and three processes are known for producing corn on it. The scarcity of land is shown by the possibility of two corn-producing processes being operated side-by-side in the cost-minimizing technique.
| Input | Industry | ||||
| Iron | Steel | Corn | |||
| I | II | III | IV | V | |
| Labor | 1 | 1 | 1 | (11/5) e1-σ t | e1-φ t |
| Land | 0 | 0 | 1 | e1-σ t | e1-φ t |
| Iron | 0 | 0 | 1/10 | (1/10) e1-σ t | (1/10) e1-φ t |
| Steel | 0 | 0 | 2/5 | (1/10) e1-σ t | (1/10) e1-φ t |
| Corn | 1/10 | 3/5 | 1/10 | (3/10) e1-σ t | (2/5) e1-φ t |
Following D'Agata, assume that one hundred acres of land are available and that net output consists of 90 tons iron, 60 tons steel, and 19 bushels corn. The net output is also the numeraire. All three commodities must be produced for any composition of net output. Table 2 lists the available techniques. Only Alpha, Delta, and Epsilon are feasible for the parameter ranges considered. Not all land is farmed and only one corn-producing process is operated under Alpha. Two corn-producing processes are operated together under Delta and Epsilon.
| Technique | Processes |
| Alpha | I, II, III |
| Beta | I, II, IV |
| Gamma | I, II, V |
| Delta | I, II, III, IV |
| Epsilon | I, II, III, V |
| Zeta | I, II, IV, V |
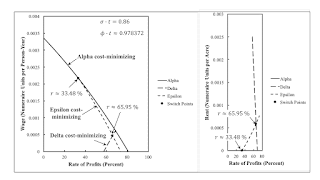
Figure 1 shows the wage curves for feasible techniques at a selected parametrization. I take the wage curve for a technique to be defined only for non-negative rates of profits at which the wage, rent per acre, and the prices of produced commodities are non-negative. The wage is negative for Delta for rates of profits below that at the switch point, and rent is negative for rates of profits greater than that at the switch point. Rent is negative for Epsilon for rates of profits less than at the switch point, and the wage is negative for greater rates of profits. Thus, the switch point is the only point on the wage curves for Delta and Epsilon. The switch point is a fluke in two ways. It is a switch point for three techniques, not two. And it is on the axis for the rate of profits.
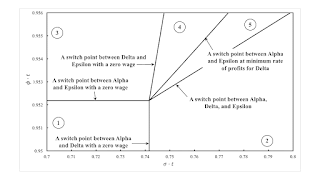
Figure 2 shows a partition of the parameter space around this fluke case. An intersection of three wage curves over the axis for the rate of profits is a combination of three pairs of wage curves intersecting over the axis for the rate of profits. These three fluke cases are the partitions between regions 1 and 2, regions 1 and 3, and regions 3 and 4. The partition between regions 2 and 5 is associated with the fluke case of three wage curves intersecting at a non-negative rate of profits. The partition between regions 4 and 5 illustrates a fluke switch point specific to models of rent.
| Figure 2: A Part of Parameter Space |
Regions 2, 4, and 5 illustrate the possible non-uniqueness and non-existence of a cost-minimizing technique. For concreteness, consider the point in region 4 with the wage curves and variation in rent per acre illustrated in Figure 3. For rates of profits up to the first switch point, Alpha is cost-minimizing. Epsilon is cost-minimizing between the switch points, and Delta is also cost-minimizing for high rates of profits in this range. Beyond the second switch point, no technique is cost-minimizing. Whether or not land is scarce depends on the distribution of income.
| Figure 3: Wage Curves and Rent for Region 4 |
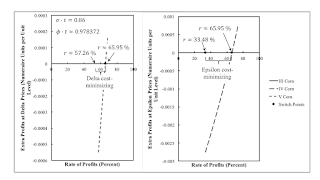
How can one determine which techniques are cost-minimizing for a given rate of profits? Given the technique and the rate of profits, the costs of the capital goods, the rent on land, and wages can be summed for a unit level for each process. Iron, steel, and corn inputs incur the going rate of profits in this sum. The difference between the revenues and this sum is the extra profits obtained in operating a process. By definition, no process comprising the technique yields extra profits. The technique is cost-minimizing if extra profits cannot be obtained by operating any other process.
For the parameters illustrated in Figure 3, extra profits are obtained by operating process IV or V at Alpha prices for a rate of profits greater than that at the first switch point. Alpha is only cost minimizing at a lower rate of profits. Figure 4 depicts the extra profits available from each corn-producing process at Delta and Epsilon prices. The range of rates of profits in which each technique is cost-minimizing is indicated, and these ranges overlap. For some rates of profits greater than the rate of profits at the second switch point, prices of production indicate that Epsilon should be adopted when prices of production for Delta prevail and that Delta should be adopted when prices of production for Epsilon prevail. This circuit is a manifestation of the non-existence of a cost-minimizing technique.
| Figure 4: Extra Profits for the Delta and Epsilon Techniques |
The cost-minimizing technique is not unique for some rates of profits in regions 2 and 5, as well as in region 4. Even though prices of production are positive for some feasible techniques, no cost-minimizing technique may exist. Table 3 summarizes how cost-minimizing techniques vary with the rate of profits in each of these five numbered regions.
| Region | Range | Technique | Notes |
| 1 | 0 ≤ r ≤ rmax, α | Alpha | No rent is paid. |
| 2 | 0 ≤ r ≤ rmin, δ | Alpha | No rent is paid. |
| rmin, δ ≤ r ≤ r1 | Alpha, Delta | The wage curve for Delta slopes up, and rent decreases with the rate of profits. | |
| 3 | 0 ≤ r ≤r1 | Alpha | No rent is paid. |
| r1 ≤ r ≤ rmax, ε | Epsilon | Rent increases with the rate of profits. | |
| 4 | 0 ≤ r ≤r1 | Alpha | No rent is paid. |
| r1 ≤ r ≤ rmin, δ | Epsilon | Rent increases with the rate of profits. | |
| rmin, δ ≤ r ≤ r2 | Delta, Epsilon | The wage curve for Delta slopes up. Rent decreases with the rate of profits for Delta and increases for Epsilon. | |
| 5 | 0 ≤ r ≤rmin, δ | Alpha | No rent is paid. |
| rmin, δ ≤ r ≤ r1 | Alpha, Delta | The wage curve for Delta slopes up, and rent decreases with the rate of profits. | |
| r1 ≤ r ≤ r2 | Delta, Epsilon | The wage curve for Delta slopes up. Rent decreases with the rate of profits for Delta and increases for Epsilon. |
Whether or not land obtains a rent can depend on the distribution of income. For a low-enough rate of profits in regions 2, 3, 4, and 5, the first three processes are operated. Iron, steel, and corn are each produced with one process, and land obtains no rent. For a higher rate of profits, the Delta or Epsilon technique can be cost-minimizing. Corn is produced by two processes, and scarce land obtains a rent. Even if the requirements for use can feasibly be satisfied with some land not farmed, the cost-minimizing technique may be such that two processes are operated side-by-side on land, with no land lying fallow.
The reverse substitution of labor, reswitching, capital reversing, the association of the truncation of the economic life of machine with a more capital-intensive technique, a divergence between the order of fertility and the order of rentability, the variation in the existence of rent with the rate of profits or the wage, and the non-uniqueness and the non-existence of a cost-minimizing technique are not fluke cases. These posts demonstrate this conclusion by contrasting these possibilities with genuine fluke cases.
 Heterodox


