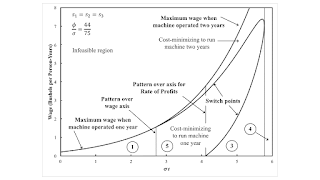
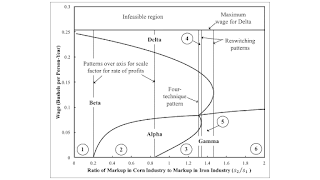
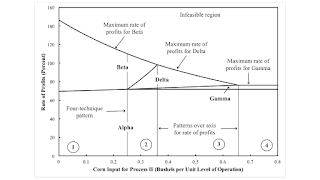
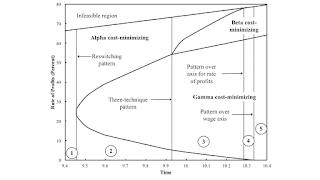
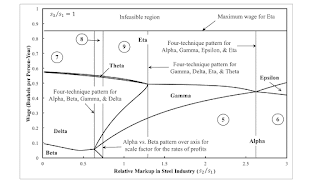
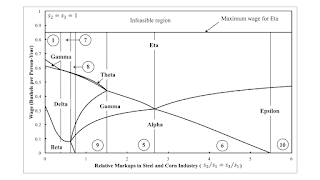
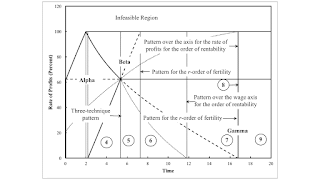
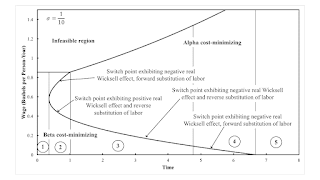
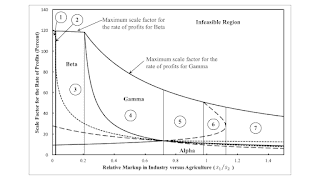
Figure 1: Variation in the Economic Life of a Machine with Technical Progress I have invented graphs for visualizing how the analysis of the choice of technique varies with perturbations of parameters in models of prices of production. This post presents some examples of one type of diagram. One must click on a link with each graph, I guess, to fully understand what is being depicted. Figure 1 is an extension of an example from Betram Schefold (21 May 2020). This example concerns technological progress and the economic life of a machine in an example of pure fixed capital. Figure 2 is from an example of two produced commodities with stable relative markups in the two industries (19 September 2020). Figure 2: The Effects of Variations in Relative Markups Figure 3 is from another
Topics:
Robert Vienneau considers the following as important:
This could be interesting, too:
Robert Vienneau writes Austrian Capital Theory And Triple-Switching In The Corn-Tractor Model
Mike Norman writes The Accursed Tariffs — NeilW
Mike Norman writes IRS has agreed to share migrants’ tax information with ICE
Mike Norman writes Trump’s “Liberation Day”: Another PR Gag, or Global Reorientation Turning Point? — Simplicius
| Figure 1: Variation in the Economic Life of a Machine with Technical Progress |
I have invented graphs for visualizing how the analysis of the choice of technique varies with perturbations of parameters in models of prices of production. This post presents some examples of one type of diagram. One must click on a link with each graph, I guess, to fully understand what is being depicted.
Figure 1 is an extension of an example from Betram Schefold (21 May 2020). This example concerns technological progress and the economic life of a machine in an example of pure fixed capital.
Figure 2 is from an example of two produced commodities with stable relative markups in the two industries (19 September 2020).
| Figure 2: The Effects of Variations in Relative Markups |
Figure 3 is from another example of fixed capital (3 November 2020). This is a two-commodity model in which machines are used in both sectors
| Figure 3: Recurrence of Truncation without Reswitching |
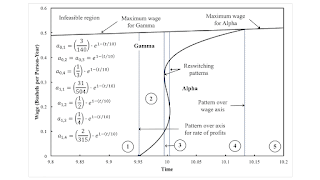
Figure 4 is from an example in which the consumption good can be produced with only circulating capital or with a machine with a physical life of two years (1 December 2020).
| Figure 4: Triple Switching with Fixed Capital |
Figure 5 is from an example in which a machine can last three years (12 December 2020).
| Figure 5: An Extension of an Example of Fixed Capital from Salvatore Barone |
Figure 6 is from a three-commodity example of non-competitive markets with variations in markups in one industry (11 May 2021).
| Figure 6: Variation of Switch Points with the Markup in the Steel Industry |
Figure 7 is from the same three-commodity example, but with variations in the markup in another industry (18 May 2021).
| Figure 7: Variation of Swith Points with the Markup in the Iron Industry |
Figure 8 is an example with extensive rent and technological progress (3 July 2021). This example concerns which type of land is marginal and thus rent-free.
| Figure 8: Structural Dynamics with Extensive Rent |
Figure 9 is from an illustration of an example to find fluke switch points (28 August 2021).
| Figure 9: Technical Progress in An Illustration of an Algorithm to Find Fluke Switch Points |
Figure 10 extends an extension of an example from Antonio D'Agata (30 December 2021).
| Figure 10: Structural Dynamics in an Example with Intensive Rent |
Figure 11 is from an example with extensive rent and markup pricing (29 September 2023).
| Figure 11: Variation with Ratio of Markups in Industry to Agriculture |
These diagrams were generated out of a research program that I have stumbled upon.
 Heterodox

