From Shimshon Bichler and Jonathan Nitzan Our RWER blog post, ‘Can capitalists afford recovery: A 2018 update’, showed U.S. unemployment to be a highly reliable leading indicator for the capitalist share of domestic income three years later. An observant commentator, though, suggested otherwise (first comment by jayarava). Although true for much of the postwar period, this association no longer holds, s/he argued. ‘Something changed after the global financial crisis to decouple unemployment from income shares’, s/he posited, pointing to the ‘new power of globalized capital to force down wages even in times of [low] unemployment’ (or rather, that during an expansion, capitalists can raise prices faster than wages, thereby augmenting their income share, which is the conventional view;
Topics:
Editor considers the following as important: Uncategorized
This could be interesting, too:
tom writes The Ukraine war and Europe’s deepening march of folly
Stavros Mavroudeas writes CfP of Marxist Macroeconomic Modelling workgroup – 18th WAPE Forum, Istanbul August 6-8, 2025
Lars Pålsson Syll writes The pretence-of-knowledge syndrome
Dean Baker writes Crypto and Donald Trump’s strategic baseball card reserve
from Shimshon Bichler and Jonathan Nitzan
Our RWER blog post, ‘Can capitalists afford recovery: A 2018 update’, showed U.S. unemployment to be a highly reliable leading indicator for the capitalist share of domestic income three years later.
An observant commentator, though, suggested otherwise (first comment by jayarava). Although true for much of the postwar period, this association no longer holds, s/he argued. ‘Something changed after the global financial crisis to decouple unemployment from income shares’, s/he posited, pointing to the ‘new power of globalized capital to force down wages even in times of [low] unemployment’ (or rather, that during an expansion, capitalists can raise prices faster than wages, thereby augmenting their income share, which is the conventional view; Profit from Crisis, 2014: 130).
This post assesses this claim more closely, by examining the correlation between (1) absolute levels of unemployment and the capitalist share of income, and (2) their respective rates of change.
Absolute levels
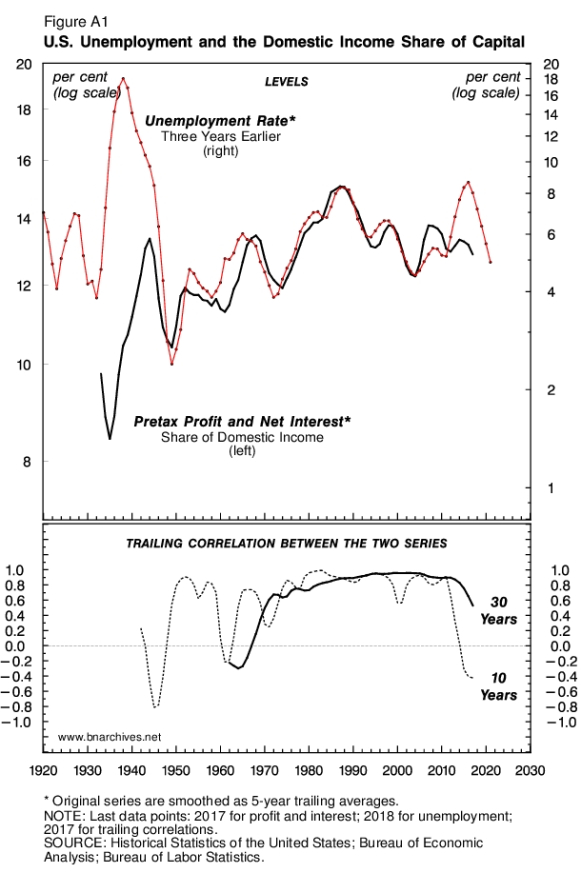
Figure A1 deals with absolute levels. The top panel shows pretax profit and net interest as a share of domestic income on the left log scale and the rate of unemployment three years earlier on the right log scale (original series are smoothed as 5-year trailing averages). The bottom panel shows two measures of correlation between these two series. The first is a 10-year trailing correlation, where each observation shows the Pearson correlation coefficient over the past ten years. The second is a 30-year trailing correlation, with each observation denoting the correlation over the past 30 years.
Until the 1960s, both correlations were unstable and occasionally negative. Unemployment certainly sabotaged the underlying population, but its effect on the capitalist share of domestic income was hardly systematic and therefore unreliable as a redistributional lever. From the 1960s onward, though, the relationship began to stabilize, and by the 1970s unemployment became an almost perfect predictor of the capitalist share of domestic income three years later. All in all, until the early 2010s, both the 10- and 30-year trailing correlations hovered around 0.9, with very minor deviations.
But then, as the commentator correctly observed, in the early 2010s things seem to have changed, with both measures dropping and the 10-year correlation becoming negative in the second half of the decade.
Whether this drop represents a meaningful ‘structural change’ remains to be seen (note that a similar drop in the correlations during the early 1960s proved temporary). Moreover, absolute levels are just one aspect of the nexus between unemployment and the capitalist share of income. The other is rates of change, and here the pattern seems unchanged.
Rates of change
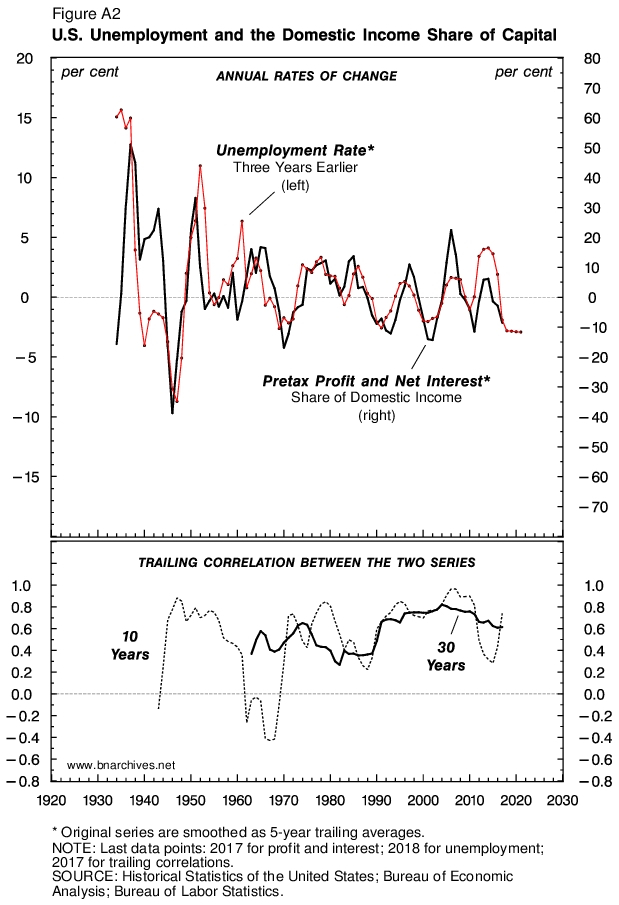
The top panel of Figure A2 plots the annual growth rates of unemployment and the capitalist share of income, while the bottom panel measures their 10-year and 30-year trailing correlations.
The overall temporal picture here is not very different from the one presented in Figure A1: the correlations between the rates of change were relatively unstable and occasionally negative till the 1960s and positive and relatively stable thereafter. The main difference concerns the decade of the 2010s. Whereas in Figure A1, the 10-year absolute levels correlation drops to negative territory, in Figure A2 the rates of change correlations – at both at the 10- and 30-year range – remain positive. As of 2017, the 30-year correlation was 0.6, while the 10-year correlation was nearly 0.8.
Judging by this figure, the efficacy of capitalist sabotage in the United States remains intact. Capitalists continue to use crisis and rising unemployment as a means of boosting their income-share-read power. In this context, the post-2009 recovery and falling unemployment are now undermining their income share, and that is something they can hardly afford, certainly not indefinitely. From this viewpoint, the end of the current recovery is a capital-as-power certainty.


