Summary:
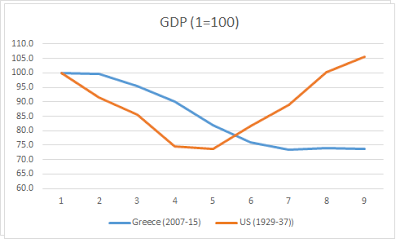
Real GDP starting in 1929 for the US and 2007 for Greece. Back then, with the New Deal, the US economy had essentially recovered after less than a decade. But there is no solution in sight for Greece now. This summer with more payments due, and the Brexit discussion on top, should bring new developments.
Topics:
Matias Vernengo considers the following as important: Greek crisis
This could be interesting, too:
Stavros Mavroudeas writes The Greek Saga: Competing Explanations of the Greek Crisis – S.Mavroudeas, New York University, 24/3/2023
Matias Vernengo writes Leo Panitch and the Lessons from Socialist Defeats
Yanis Varoufakis writes The new austerity tsunami about to hit Greece, Italy et al – EURONEWS (VIDEO)
Yanis Varoufakis writes Yanis Varoufakis: “Syriza Was a Bigger Blow to the Left Than Thatcher” – JACOBIN
Real GDP starting in 1929 for the US and 2007 for Greece. Back then, with the New Deal, the US economy had essentially recovered after less than a decade. But there is no solution in sight for Greece now. This summer with more payments due, and the Brexit discussion on top, should bring new developments.

