From C. P. Chandrasekhar and Jayati Ghosh Once again, low and middle income countries (LMICs) are at the brutal receiving end of the fickle trajectory of international capital flows. As Figure 1 indicates, net financial flows to such countries, which increased rapidly after the Global Financial Crisis that began and was created by advanced economies, peaked in 2014. Thereafter, they have been on a downward trend, which has accelerated dramatically from 2021, to the point that they turned negative in 2023, and are expected to fall further in 2024. In 2023, LMICs as a group (excluding China) sent an estimated .4 billion (which they could ill afford to do) outside—and by 2024 that number is expected to more than double, such that these countries will be sending as much as .5
Topics:
Editor considers the following as important: Uncategorized
This could be interesting, too:
tom writes The Ukraine war and Europe’s deepening march of folly
Stavros Mavroudeas writes CfP of Marxist Macroeconomic Modelling workgroup – 18th WAPE Forum, Istanbul August 6-8, 2025
Lars Pålsson Syll writes The pretence-of-knowledge syndrome
Dean Baker writes Crypto and Donald Trump’s strategic baseball card reserve
from C. P. Chandrasekhar and Jayati Ghosh
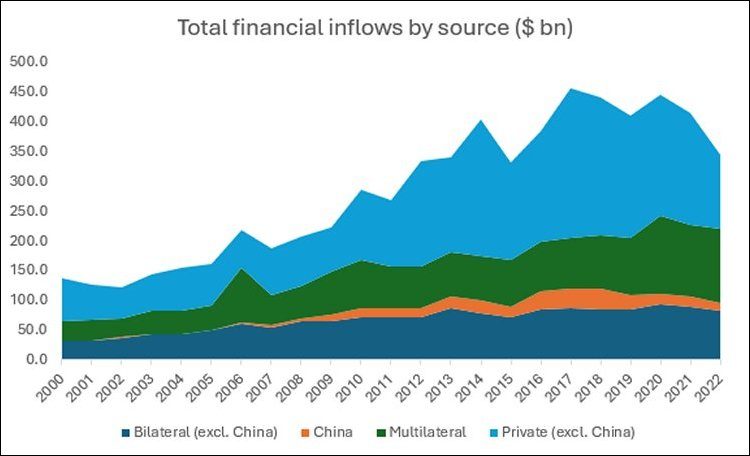
Once again, low and middle income countries (LMICs) are at the brutal receiving end of the fickle trajectory of international capital flows. As Figure 1 indicates, net financial flows to such countries, which increased rapidly after the Global Financial Crisis that began and was created by advanced economies, peaked in 2014. Thereafter, they have been on a downward trend, which has accelerated dramatically from 2021, to the point that they turned negative in 2023, and are expected to fall further in 2024. In 2023, LMICs as a group (excluding China) sent an estimated $21.4 billion (which they could ill afford to do) outside—and by 2024 that number is expected to more than double, such that these countries will be sending as much as $50.5 billion, mostly to rich economies and multilateral financial institutions.
Figure 1.

Source for Figures 1-3: https://data.one.org/data-dives/net-finance-flows-to-developing-countries/
Some of this is obviously because of the fickleness and volatility of private capital markets, which exhibit both irrationality and herd behaviour that adversely affect recipient countries. It is evident from Figure 2 that private capital markets exhibited significantly increased appetite for investments in LMICs, especially after 2009, when expansionary monetary policies and very low-to-negative interests in the advanced economies provided financial investors with cheap money to invest even in areas that were earlier considered to be too “risky”. From an average of around $68 bn in the decade up to 2009, private capital inflows grew dramatically thereafter, peaking at $252 bn in 2017. This is why private players currently hold more than half of the debt of LMICs.
But from 2018 onwards, the fall in gross private inflows to LMICs has been dramatic, such that gross inflows in 2022 were less than half of the 2017 level, at $124 bn. Other sources of capital—from bilateral aid to funds from multilateral institutions—have failed to counterbalance these tendencies.
Figure 2.

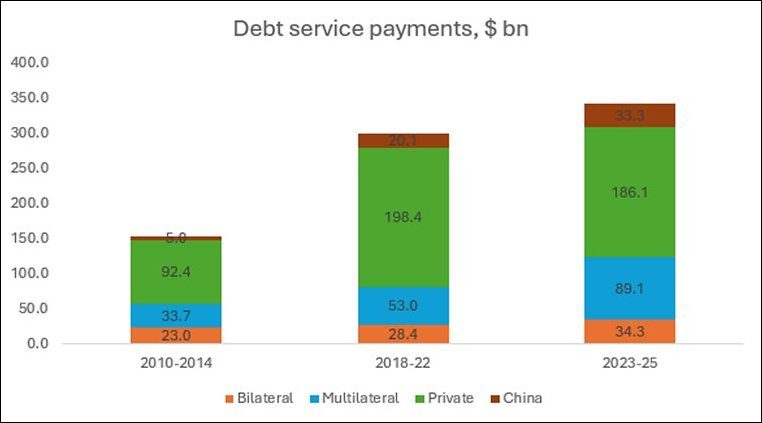
Indeed, the fall in gross inflows has been matched by sharp, even dramatic, increases in interest payments and other charges imposed upon LMICs, making debt repayment obligations extremely onerous. This only partly reflects the increase in base interest rates as central banks in advanced economies began a process of tightening their monetary policies. As the base interest rate rose, the spreads on debt issued by LMIC borrowers—both sovereign and private debtors—rose even more, as we have shown in an earlier analysis. As a result, even as net debt inflows have fallen, debt service obligations have increased massively, as shown in Figure 3.
In the period 2010-14, debt service payments from LMICs averaged at around $154 bn per year, but these ballooned to just under $300 bn in the period 2018-22. In the current period, covering the years 2023-25, debt service payments by LMICs are projected to amount to nearly $343 bn per year. In the period 2018-22, private creditors (mainly bond holders) garnered two-thirds to total debt repayment; even in the current period, they are expected to receive significantly above half of such payments. This is because they typically charge significantly higher interest rates and because bond prices of LMICs are so strongly affected by market sentiment and investor perceptions of “risk” (even when these are clearly unjustified) that the returns on such investments have been higher.
Figure 3.

As a result, 26 countries (including Angola, Pakistan and Vietnam to name just a few) had net negative transfers, paying a total of $48 bn more in debt service than they received in all forms of new external finance. It has been estimated that the number of countries experiencing such negative transfer could increase to 44 in 2025, with net outflows of $102 bn.
In a way, this should not surprise us: the inherent instability, procyclicality and boom-and-bust cycles of private financial markets have been common knowledge for a while, and both advanced economies and lower-income countries have been victims of this in many episodes of financial crisis over the past half-century.
But what is especially surprising and even alarming, is that the tendency to procyclicality is not confined to private players, but appears to be widespread among the multilateral financial institutions that were after all created to counter these tendencies. We now know that there have been sharp declines in net lending by the very institutions that should have dramatically increased their lending to LMICs in the recent period, when private markets were no longer delivering the required resources.
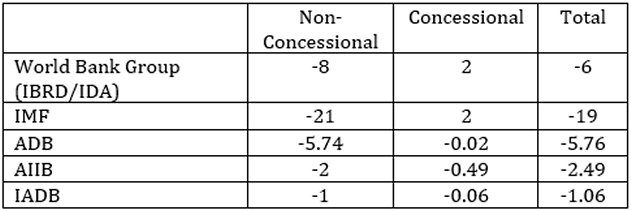
Table 1 shows the change in net financial resource transfer between 2022 and 2023, and the numbers are shocking. Net transfers by the IMF fell by a whopping $19 bn, counting both non-concessional lending, while those by the World Bank Group (specifically the IBRD and the IDA) fell by $ 6 bn. The regional development banks similarly showed declines in net resource transfer.
Table 1: Change in net transfers by International Financial Institutions from 2022 to 2023, $ bn

Source: G20 Independent Expert Group, https://icrier.org/g20-ieg/report.html
There could not be any more telling or severe indictment of the functioning of these institutions. There have been, and continue to be, major concerns with the programming of these institutions, especially the IMF and its hatchet-like insistence on fiscal consolidation in declining economies (despite statements claiming that they no longer support this). But these numbers suggest something even more appalling: these institutions are not fulfilling their basic role of providing countercyclical financial resources to countries in need when markets fail to deliver them. This was the basic purpose of the IMF and the reason why it was set up, so to fail on this most basic requirement is actually beyond belief.
This is made worse by the IMF’s insistence on retaining the practice of imposing surcharges and fees upon countries that have been forced to take on large IMF loans or persist with IMF programmes for an extended period. The very fact that some countries have taken repeated IMF programmes is a sign of the failure of the institution to enable or support effective recovery—and this cannot be blamed on the recipient country alone, since there is at least equal fault f of the IMF and the policy conditions it has imposed. Yet the IMF continues to add to the woes of countries in severe economic distress: the surcharges have been estimated to increase the cost of borrowing by as much as 57 per cent for the five top surcharge-paying countries alone.
Clearly, international financial institutions are in need of more than just tinkering reform—they will need a drastic overhaul if they are to start fulfilling their basic roles in the global economy.
