From Steven Pressman According to Thomas Piketty (2014), between 1980 and 2010 the share of total US income going to the top 10% of earners rose from around 30-35%, where it stood for several decades, to nearly 50%. These are very conservative estimates. Piketty’s figures come from the distribution of adjusted gross income (AGI), reported by the US Internal Revenue Service. AGI subtracts from income things like investment losses, retirement account contributions and their returns (see Pressman 2015, Chapter 2). With large adjustments, someone can make a lot of money but have little AGI; or, as in the case of Donald Trump, you can report a negative AGI of nearly billion. In addition, tax-free income (such as unrealized capital gains and interest on municipal bonds), as well as returns on money hidden in tax havens, are not reported to the IRS and do not appear in AGI. Like the adjustments helping Trump avoid taxes, this income mainly goes to the wealthy and has been growing for several decades (Zucman, 2015). As the rich received a bigger piece of the pie, everyone else got relatively less. We can see this in the falling share of income going to the middle-three income quintiles (Figure 1). One standard economic argument for great inequality is that it generates incentives to make money and contributes to economic growth, which increases average living standards.
Topics:
Editor considers the following as important: Uncategorized
This could be interesting, too:
tom writes The Ukraine war and Europe’s deepening march of folly
Stavros Mavroudeas writes CfP of Marxist Macroeconomic Modelling workgroup – 18th WAPE Forum, Istanbul August 6-8, 2025
Lars Pålsson Syll writes The pretence-of-knowledge syndrome
Dean Baker writes Crypto and Donald Trump’s strategic baseball card reserve
from Steven Pressman
According to Thomas Piketty (2014), between 1980 and 2010 the share of total US income going to the top 10% of earners rose from around 30-35%, where it stood for several decades, to nearly 50%. These are very conservative estimates. Piketty’s figures come from the distribution of adjusted gross income (AGI), reported by the US Internal Revenue Service. AGI subtracts from income things like investment losses, retirement account contributions and their returns (see Pressman 2015, Chapter 2). With large adjustments, someone can make a lot of money but have little AGI; or, as in the case of Donald Trump, you can report a negative AGI of nearly $1 billion. In addition, tax-free income (such as unrealized capital gains and interest on municipal bonds), as well as returns on money hidden in tax havens, are not reported to the IRS and do not appear in AGI. Like the adjustments helping Trump avoid taxes, this income mainly goes to the wealthy and has been growing for several decades (Zucman, 2015).
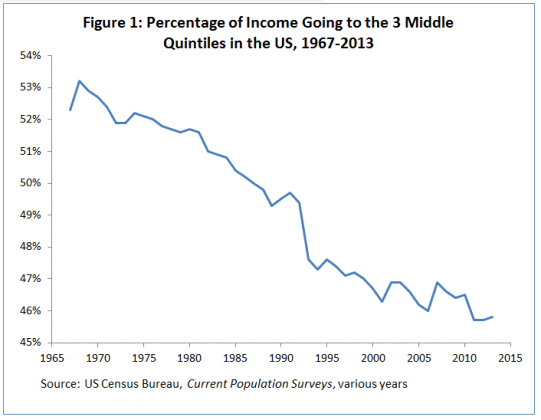
As the rich received a bigger piece of the pie, everyone else got relatively less. We can see this in the falling share of income going to the middle-three income quintiles (Figure 1).
One standard economic argument for great inequality is that it generates incentives to make money and contributes to economic growth, which increases average living standards. Even if this is true, not everyone benefits from growth. Saez and Piketty (2013) estimate that since the late 1970s nearly 60% of all gains from growth have gone to the top 1%, roughly those making $500,000 or more in 2016.[1] Consequently, a typical US household has seen little improvement in their absolute standard of living for several decades. We can see this in figures on real median household income, which increased only slightly over the past quarter century – growing from $54,432 in 1988 to $56,516 in 2015.[2]
We focus here on another distributional measure – the size of the middle class. A thriving middle class is important for a number of reasons. First, there are political factors. Rothstein & Uslaner (2005, p. 52) argue that inequality reduces social capital or the trust needed to sustain democracy. Second, Robert Malthus (2008[1803], p. 594) noted: “Our best grounded expectations of an increase in the happiness of the mass of human society are founded in the prospect of an increase in the relative proportions of the middle parts.” For Malthus, the additional income that moves one from poverty into the middle class is what makes life worthwhile. Finally, a large middle class improves economic performance. Alfred Marshall (1920, pp. 529-32, 566-9) noted that higher earnings may improve the habits of working people, thereby improving productivity and everyone’s standard of living. From a Keynesian perspective, a large middle class increases consumption, effective demand and economic growth because middle-class households tend to spend larger fractions of their income than wealthy households. read more
[1] The thresholds in Saez and Piketty (2013) need to be increased due to inflation and income not included in AGI.
[2] Remarkably, the 2014 figure was below the 1988 figure.

