From David Ruccio Skellington is right: in my post on Tuesday, I did not separate out people at the very top from the rest of those at the top. That’s because, in the data I presented, those in the top 0.1 percent were included in the top 1 percent. Unfortunately, I don’t have the same kind of breakdown in the composition of incomes as I used in those charts. What I do have are data on the shares of income and wealth for the top 0.1 percent versus the remainder of the top 1 percent (so, top 1 percent to but not including the top 0. 1 percent). Clearly, income within the top 1 percent is unequally distributed—and has gotten more unequal over time. While the top 0.1 percent (approximately 326.5 thousand individuals) captured about 9.3 of pre-tax income in 2014 (up from 3.9 percent in 1979), the remainder of the top 1 percent (and thus about 2.9 million individuals) took home about 10.9 percent of pre-tax income in 2014 (up from 7.3 percent in 1979). Over time (from 1979 to 2014), the top 0.1 percent has increased its share of the income going to the top 1 percent from a bit more than a third (35 percent) to almost half (46 percent). The distribution of wealth within the top 1 percent is even more unequally distributed than the distribution of income—and it, too, has become more unequal over time. While the top 0.1 percent owned about 19.
Topics:
David F. Ruccio considers the following as important: Uncategorized
This could be interesting, too:
tom writes The Ukraine war and Europe’s deepening march of folly
Stavros Mavroudeas writes CfP of Marxist Macroeconomic Modelling workgroup – 18th WAPE Forum, Istanbul August 6-8, 2025
Lars Pålsson Syll writes The pretence-of-knowledge syndrome
Dean Baker writes Crypto and Donald Trump’s strategic baseball card reserve
from David Ruccio
Skellington is right: in my post on Tuesday, I did not separate out people at the very top from the rest of those at the top. That’s because, in the data I presented, those in the top 0.1 percent were included in the top 1 percent.
Unfortunately, I don’t have the same kind of breakdown in the composition of incomes as I used in those charts. What I do have are data on the shares of income and wealth for the top 0.1 percent versus the remainder of the top 1 percent (so, top 1 percent to but not including the top 0. 1 percent).
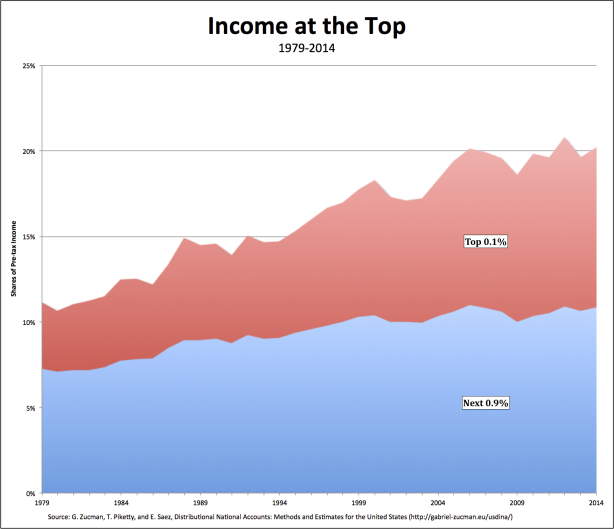
Clearly, income within the top 1 percent is unequally distributed—and has gotten more unequal over time. While the top 0.1 percent (approximately 326.5 thousand individuals) captured about 9.3 of pre-tax income in 2014 (up from 3.9 percent in 1979), the remainder of the top 1 percent (and thus about 2.9 million individuals) took home about 10.9 percent of pre-tax income in 2014 (up from 7.3 percent in 1979). Over time (from 1979 to 2014), the top 0.1 percent has increased its share of the income going to the top 1 percent from a bit more than a third (35 percent) to almost half (46 percent).
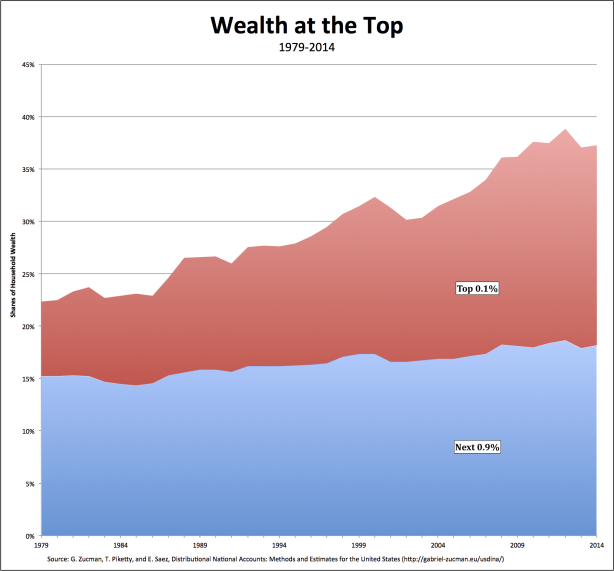
The distribution of wealth within the top 1 percent is even more unequally distributed than the distribution of income—and it, too, has become more unequal over time. While the top 0.1 percent owned about 19.1 percent of total household wealth in 2014 (up from 7.2 percent in 1979), the remainder of the top 1 percent owned about 18. 2 percent of household wealth in 2014 (up from 15.2 percent in 1979). Thus, over time, the top 0.1 percent has increased its share of household wealth owned by the top 1 percent from about one third (32 percent) to over half (51.3 percent).
The conclusions, then, are straightforward: For decades now, those at the top have managed to pull away—in terms of both income and wealth—from everyone else in the United States. And, by the same token, those at the very top have been distancing themselves from everyone else at the top.
No matter how much they do battle over their respective shares, the one thing that ties together those at the top and those at the very top is that their income and accumulated wealth derive from the surplus created by the bottom 90 percent.


