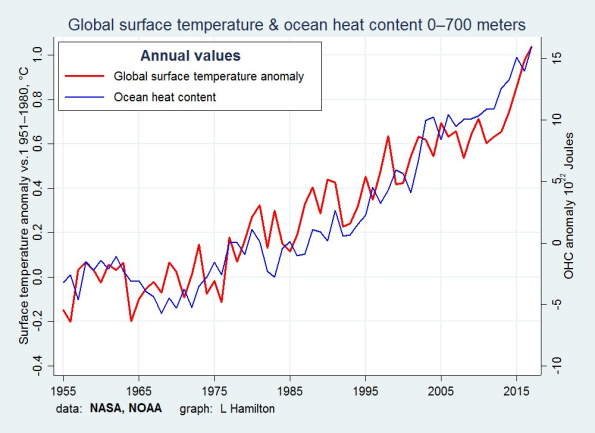
From: Larry Hamilton and Merijn Knibbe Following a twitter discussion between him and me about the question if the 2013-2015 warming of the first 700 meters of ocean was above trend or if 2016 was below trend, Larry Hamilton (@ichiloe) produced the next graph (which shows consistent and relentless warming not just of the surface of the earth but also of the first 700 meters of the oceans). These series are as far as I know measured in a totally independent way. ‘2017’ are partial data. We do not rest our case.
Topics:
Merijn T. Knibbe considers the following as important: Uncategorized
This could be interesting, too:
tom writes The Ukraine war and Europe’s deepening march of folly
Stavros Mavroudeas writes CfP of Marxist Macroeconomic Modelling workgroup – 18th WAPE Forum, Istanbul August 6-8, 2025
Lars Pålsson Syll writes The pretence-of-knowledge syndrome
Dean Baker writes Crypto and Donald Trump’s strategic baseball card reserve
From: Larry Hamilton and Merijn Knibbe
Following a twitter discussion between him and me about the question if the 2013-2015 warming of the first 700 meters of ocean was above trend or if 2016 was below trend, Larry Hamilton (@ichiloe) produced the next graph (which shows consistent and relentless warming not just of the surface of the earth but also of the first 700 meters of the oceans). These series are as far as I know measured in a totally independent way. ‘2017’ are partial data. We do not rest our case.

