I came across the following graph: (Click to embiggen) Both the supply curve for labor in the state of California and the demand curve for housing in California are made up of the states residents. In general, if you increase the supply of something, all else being equal you bring down its price. On the other hand, if you increase the demand for something, all else being equal you increase its price. The graph above suggests that in California, two things have happened. One is that the supply of labor has increased more rapidly than its demand. Conversely, the demand for housing has increased more rapidly than its supply.
Topics:
Mike Kimel considers the following as important: california, rent, supply and demand, Uncategorized, wages
This could be interesting, too:
tom writes The Ukraine war and Europe’s deepening march of folly
Stavros Mavroudeas writes CfP of Marxist Macroeconomic Modelling workgroup – 18th WAPE Forum, Istanbul August 6-8, 2025
Lars Pålsson Syll writes The pretence-of-knowledge syndrome
Dean Baker writes Crypto and Donald Trump’s strategic baseball card reserve
I came across the following graph:
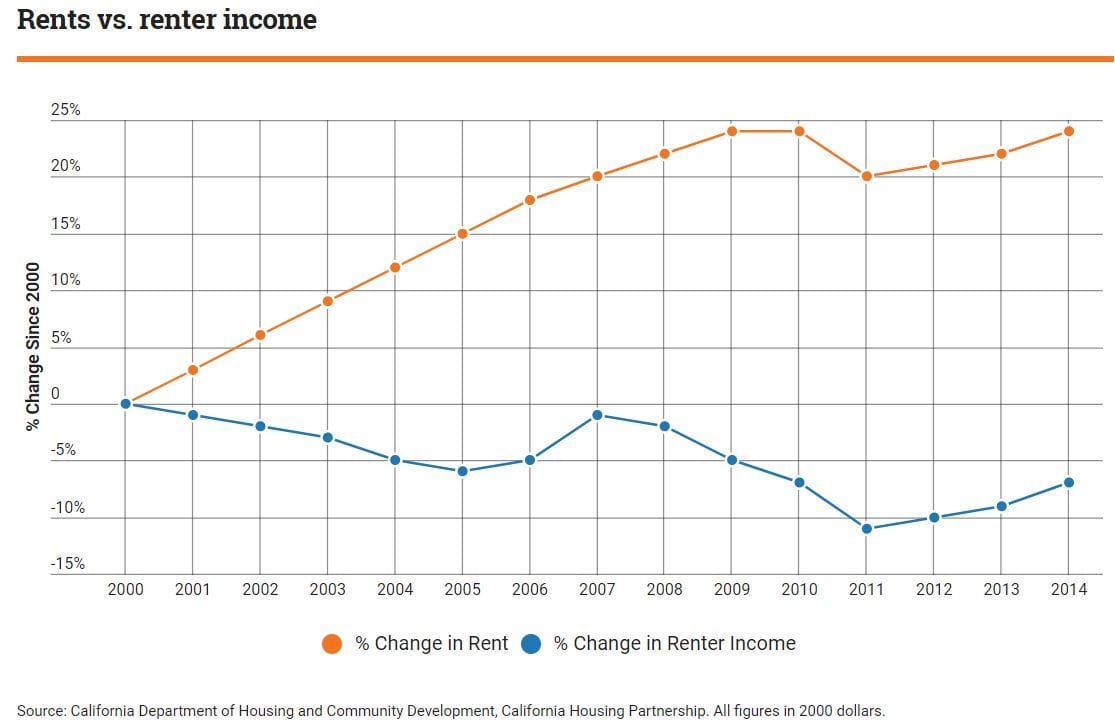
(Click to embiggen)
Both the supply curve for labor in the state of California and the demand curve for housing in California are made up of the states residents.
In general, if you increase the supply of something, all else being equal you bring down its price. On the other hand, if you increase the demand for something, all else being equal you increase its price. The graph above suggests that in California, two things have happened. One is that the supply of labor has increased more rapidly than its demand. Conversely, the demand for housing has increased more rapidly than its supply.