From David Ruccio The latest Federal Reserve Board’s triennial Survey of Consumer Finances (pdf) is out and the news is not good—at least for the majority of Americans. They’re falling further and further behind those at the top. Sure, on the surface, the results for the latest period of recovery from the Second Great Depression appear to be positive. Between 2013 and 2016, real gross domestic product in the United States grew at an annual rate of 2.2 percent, the civilian unemployment rate fell from 7.5 percent to 5 percent, and the annual rate of inflation averaged only 0.8 percent. However, data from the 2016 Survey also indicate that the shares of income and wealth held by affluent households have reached historically high levels—and, for the bottom 90 percent, they continue to
Topics:
David F. Ruccio considers the following as important: Uncategorized
This could be interesting, too:
tom writes The Ukraine war and Europe’s deepening march of folly
Stavros Mavroudeas writes CfP of Marxist Macroeconomic Modelling workgroup – 18th WAPE Forum, Istanbul August 6-8, 2025
Lars Pålsson Syll writes The pretence-of-knowledge syndrome
Dean Baker writes Crypto and Donald Trump’s strategic baseball card reserve
from David Ruccio
The latest Federal Reserve Board’s triennial Survey of Consumer Finances (pdf) is out and the news is not good—at least for the majority of Americans. They’re falling further and further behind those at the top.
Sure, on the surface, the results for the latest period of recovery from the Second Great Depression appear to be positive. Between 2013 and 2016, real gross domestic product in the United States grew at an annual rate of 2.2 percent, the civilian unemployment rate fell from 7.5 percent to 5 percent, and the annual rate of inflation averaged only 0.8 percent.
However, data from the 2016 Survey also indicate that the shares of income and wealth held by affluent households have reached historically high levels—and, for the bottom 90 percent, they continue to fall.
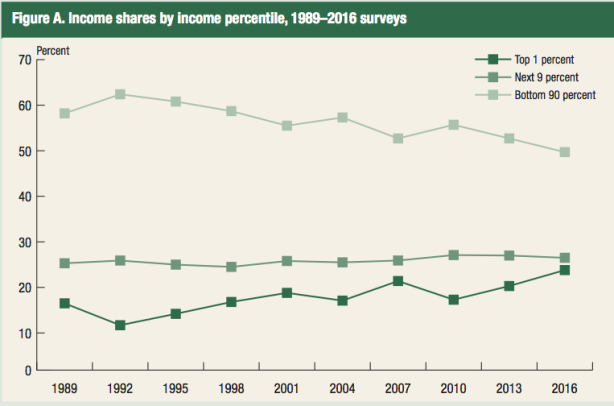
For example, examining the chart at the top of this post, the share of income captured by the top 1 percent of families, which was 20.3 percent in 2013, rose to 23.8 percent in 2016. The top 1 percent of families now receives nearly as large a share of total income as the next highest 9 percent of families combined (percentiles 91 through 99), who received 26.5 percent of all income—a share that has remained fairly stable over the past quarter of a century. Correspondingly, the rising income share of the top 1 percent mirrors the declining income share of the bottom 90 percent of the distribution, which fell to less than half (49.7 percent) in 2016.
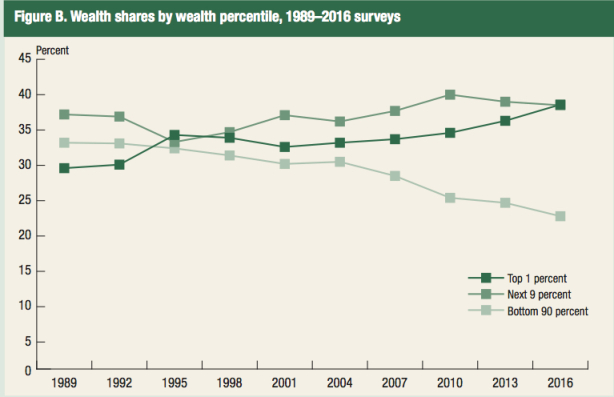
And the degree of inequality in the distribution of wealth is even worse. The share of the top 1 percent climbed from 36.3 percent in 2013 to 38.6 percent in 2016, surpassing the wealth share of the next highest 9 percent of families combined. After rising over the second half of the 1990s and most of the 2000s, the wealth share of the next highest 9 percent of families has actually been falling since 2010, reaching 38.5 percent in 2016. Similar to the situation with income, the wealth share of the bottom 90 percent of families has been decreasing for most of the past 25 years, dropping from 33.2 percent in 1989 to only 22.8 percent in 2016.

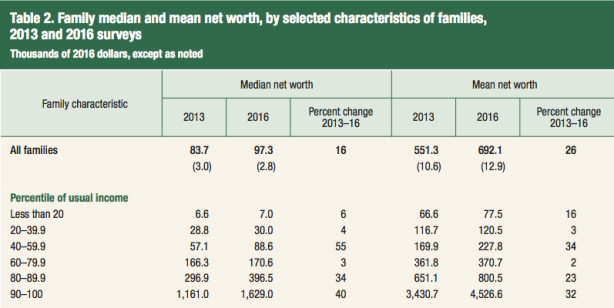
Another way of illustrating the grotesquely unequal distribution of wealth in the United States is in terms of median net worth (as in the table above). As it turns out, the median net worth of the top decile is more than four times the level of the next highest decile group and more than 230 times that of the bottom two deciles—in both cases, even larger than the gaps that existed in 2013.
No one in charge—whether in the government, at the head of large corporations and banks, or in the discipline of economics—has a single idea or policy to offer to fix these growing income and wealth disparities.
And the rest of us? Once again, we’re learning to appreciate the “Feelin’ Bad Blues.”


