“US Trade Deficit Rises 4.8% in February to Record High,” Commenter R.J.S. at Marketwatch 666 Our trade deficit rose 4.8% February, as both our exports and imports decreased, but the value of our exports fell by almost three times as much as the value of our imports did….the Commerce Department report on our international trade in goods and services for February indicated that our seasonally adjusted goods and services trade deficit rose by .3 billion to .1 billion in February, from a January deficit that was revised down to .8 billion from the .2 billion deficit reported a month ago…in rounded figures, the value of our February exports fell by .0 billion to 7.3 billion on .8 billion decrease to 1.1 billion in our exports of
Topics:
run75441 considers the following as important: US EConomics
This could be interesting, too:
NewDealdemocrat writes JOLTS revisions from Yesterday’s Report
Bill Haskell writes The North American Automobile Industry Waits for Trump and the Gov. to Act
Bill Haskell writes Families Struggle Paying for Child Care While Working
Joel Eissenberg writes Time for Senate Dems to stand up against Trump/Musk
“US Trade Deficit Rises 4.8% in February to Record High,” Commenter R.J.S. at Marketwatch 666
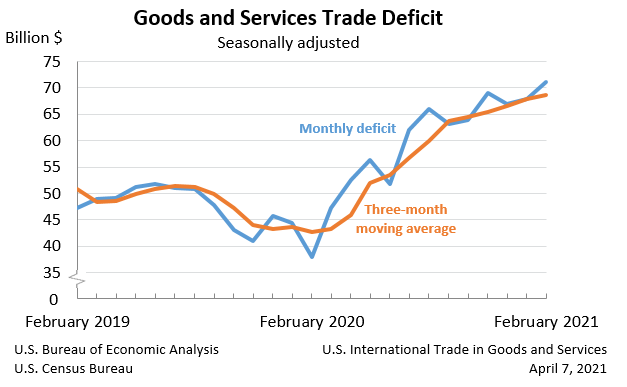
Our trade deficit rose 4.8% February, as both our exports and imports decreased, but the value of our exports fell by almost three times as much as the value of our imports did….the Commerce Department report on our international trade in goods and services for February indicated that our seasonally adjusted goods and services trade deficit rose by $3.3 billion to $71.1 billion in February, from a January deficit that was revised down to $67.8 billion from the $68.2 billion deficit reported a month ago…in rounded figures, the value of our February exports fell by $5.0 billion to $187.3 billion on $4.8 billion decrease to $131.1 billion in our exports of goods and a $0.2 billion decrease to $56.1 billion in our exports of services, while our imports fell $1.7 billion to $258.3 billion as a $2.0 billion decrease to $219.1 billion in our imports of goods was partially offset by a $0.3 billion increase to $39.2 billion in our imports of services….export prices averaged 1.6% higher in February, which means our real exports fell more month over month than the nominal decrease by that percentage, while import prices rose 1.3%, meaning that the contraction in real imports was greater than the nominal decrease reported here by that percentage…
The decrease in our February exports of goods resulted from lower exports of capital goods, consumer goods, soybeans, and of automotive vehicles, parts and engines…referencing the Full Release and Tables for February (pdf), in Exhibit 7 we find that our exports of capital goods fell by $2,451 million to $39,094 million, led by a $738 million decrease in our exports of industrial machines other than those itemized separately, a $459 million decrease in our exports of civilian aircraft, and a $409 million decrease in our exports of semiconductors, and that our exports of consumer goods fell by $937 million to $15,049 million on a $470 million decrease in our exports of gem diamonds; in addition, our exports of foods, feeds and beverages fell by $727 million to $13,166 million on a $889 million decrease in our exports of soybeans, and our exports of automotive vehicles, parts, and engines fell by $703 million to $11,899 million on a $319 million decrease in our exports of parts and accessories of vehicles other than tires, engines and chassis and a $280 million decrease in our exports of new and used passenger cars, while our exports in other goods not categorized by end use fell by $372 million to $4,968 million . . . partially offsetting the decreases in those end use categories, our exports of industrial supplies and materials rose by $352 million to $46,448 million as a $2,399 million increase in our exports of natural gas and a $503 million increase in our exports of non-monetary gold were partly offset by a $824 million decrease in our exports of crude oil, a $326 million decrease in our exports of plastic materials, and a $300 million decrease in our exports of natural gas liquids…
Exhibit 8 in the Full Release and Tables gives us seasonally adjusted details on our imports of goods and shows that lower imports of automotive vehicles, parts, and engines and of consumer goods were responsible for the $2.0 billion decrease in our February imports, while their impact was partly offset by greater imports of industrial supplies and materials…our imports of automotive vehicles, parts and engines fell by $3,393 million to $28,184 million on a $1,768 million decrease in our imports of passenger cars, a $633 million decrease in our imports of trucks, buses, and special purpose vehicles, and a $589 million decrease in our imports of parts and accessories of vehicles other than tires, engines and chassis, and our imports of consumer goods fell by $2,674 million to $60,665 million as a $3,876 million decrease in our imports of pharmaceuticals and a $438 million decrease in our imports of household appliances were partially offset by a $737 million increase in our imports of artwork, antiques, and other collectibles…in addition, our imports of foods, feeds, and beverages fell by $669 million to $13,116 million on decreases in imports of most food & feed categories and a $285 million decrease in imports of foods other than those itemized separately…partially offsetting the decreases in those end use categories, our imports of industrial supplies and materials rose by $3,531 million to $46,586 million on a $1,056 million increase in our imports of finished metal shapes, a $963 million increase in our imports of crude oil, an $874 million increase in our imports of natural gas, a $535 million increase in our imports of precious metals other than those itemized, and a $395 million increase in our imports of petroleum products other than those itemized, and our imports of capital goods rose by $159 million to $57,707 million as a $951 million increase in our imports of civilian aircraft was partly offset by a $420 million increase in our imports of computers, and lastly our imports of other goods not categorized by end use rose by $924 million to $9,483 million…
The press release for this month’s report summarizes Exhibit 19 in the full release pdf for February, which gives us surplus and deficit details on our goods trade with selected countries:
The February figures show surpluses, in billions of dollars, with South and Central America ($3.7), Brazil ($1.4), Hong Kong ($1.2), Singapore ($0.6), United Kingdom ($0.2), and Saudi Arabia ($0.1). Deficits were recorded, in billions of dollars, with China ($30.3), European Union ($19.0), Mexico ($6.8), Germany ($5.3), Japan ($4.5), Canada ($4.0), Italy ($3.2), France ($2.7), Taiwan ($2.4), South Korea ($2.3), and India ($1.7).
– The deficit with China increased $3.1 billion to $30.3 billion in February. Exports decreased $4.5 billion to $10.4 billion and imports decreased $1.5 billion to $40.6 billion.
– The deficit with Canada increased $2.2 billion to $4.0 billion in February. Exports decreased $0.5 billion to $23.7 billion and imports increased $1.7 billion to $27.7 billion.
– The deficit with Mexico decreased $5.1 billion to $6.8 billion in February. Exports increased $2.1 billion to $22.8 billion and imports decreased $3.0 billion to $29.6 billion.
To gauge the impact of January and February trade on 1st quarter GDP growth figures, we use exhibit 10 in the full pdf for this report, which gives us monthly goods trade figures by end use category and in total, already adjusted for inflation in chained 2012 dollars, the same inflation adjustment that’s used by the BEA to compute trade figures for GDP, with the only difference being that the amounts are not annualized here….from that table, we can figure that the 4th quarter’s real exports of goods averaged 145,373.7 million monthly in chained 2012 dollars, while inflation adjusted 1st quarter goods exports were at 147,294 million and 139,441 million for January and February respectively in that same 2012 dollar quantity index representation…averaging January’s and February’s goods exports and then computing the annualized change between that average and the average of the fourth quarter, we find that the 1st quarter’s real exports of goods are running at a 5.4068% annual rate below those of the 4th quarter, or at a pace that would subtract about 0.33 percentage points from 1st quarter GDP….. in a similar manner, we find that our 4th quarter real imports of goods averaged 239,602.7 million monthly in chained 2012 dollars, while inflation adjusted January and February imports were at 243,409 million and 238,534 million respectively, after that same 2012 chained dollars inflation adjustment…that would indicate that so far in the 1st quarter, our real imports of goods have increased at a 2.305% annual rate from those of the 4th quarter…since increases in imports subtract from GDP because they represent the portion of consumption or investment that occurred during the quarter that was not produced domestically, their increase at a 2.3% rate would subtract about 0.26 percentage points from 1st quarter GDP….hence, if the average trade deficit in goods of the two months reported here is continued in March, the net effect of our international trade in goods will be to subtract around 0.59 percentage points from 1st quarter GDP…
Note that we have not computed the impact of the usually less volatile change in services here because the Census does not provide inflation adjusted data on those, but that the $0.2 billion decrease in exports of services and the $0.3 billion increase in imports of services both suggest that February’s trade in services would also be a subtraction from 1st quarter GDP, after the change January’s exports and imports in services were close to equal…