RJS, MarketWatch 666, October’s Case–Shiller HPI; Advance Economic Indicators for November With the major month end reports already released last week, the only widely watched report released this week was the Case-Shiller Home Price Index for October from S&P Case-Shiller, which doesn’t even report any prices of homes, but just a index generated by averaging relative sales prices of homes that sold during August, September and October against the sales prices of the same homes when they sold during prior 3 month periods going back to January of 2000 . . . by comparing repeat home sales prices on that basis, the Case-Shiller report indicated that their national home price index for those 3 months averaged 19.1% higher than it did for the same homes
Topics:
run75441 considers the following as important: MarketWatch 666, RJS, US EConomics
This could be interesting, too:
NewDealdemocrat writes JOLTS revisions from Yesterday’s Report
Bill Haskell writes The North American Automobile Industry Waits for Trump and the Gov. to Act
Bill Haskell writes Families Struggle Paying for Child Care While Working
Joel Eissenberg writes Time for Senate Dems to stand up against Trump/Musk
RJS, MarketWatch 666, October’s Case–Shiller HPI; Advance Economic Indicators for November
With the major month end reports already released last week, the only widely watched report released this week was the Case-Shiller Home Price Index for October from S&P Case-Shiller, which doesn’t even report any prices of homes, but just a index generated by averaging relative sales prices of homes that sold during August, September and October against the sales prices of the same homes when they sold during prior 3 month periods going back to January of 2000 . . . by comparing repeat home sales prices on that basis, the Case-Shiller report indicated that their national home price index for those 3 months averaged 19.1% higher than it did for the same homes that sold during the same 3 month period a year earlier, which was down from the 19.7% year over year index increase indicated by their September report, which covered sales prices from July, August and September….otherwise, this week also saw the last two of the regional Fed manufacturing surveys for December: the Dallas Fed Texas Manufacturing Outlook Survey reported their general business activity composite index fell to +8.1 from November’s +11.8, suggesting that the Texas manufacturing economy is growing slightly slower than a month ago, while the Richmond Fed Survey of Manufacturing Activity, covering an area that includes Virginia, Maryland, the Carolinas, the District of Columbia and West Virginia, reported their broadest composite index rose to +16 in December from +12 in November, indicating that a larger plurality of that region’s manufactures reported better conditions in December than a month earlier…
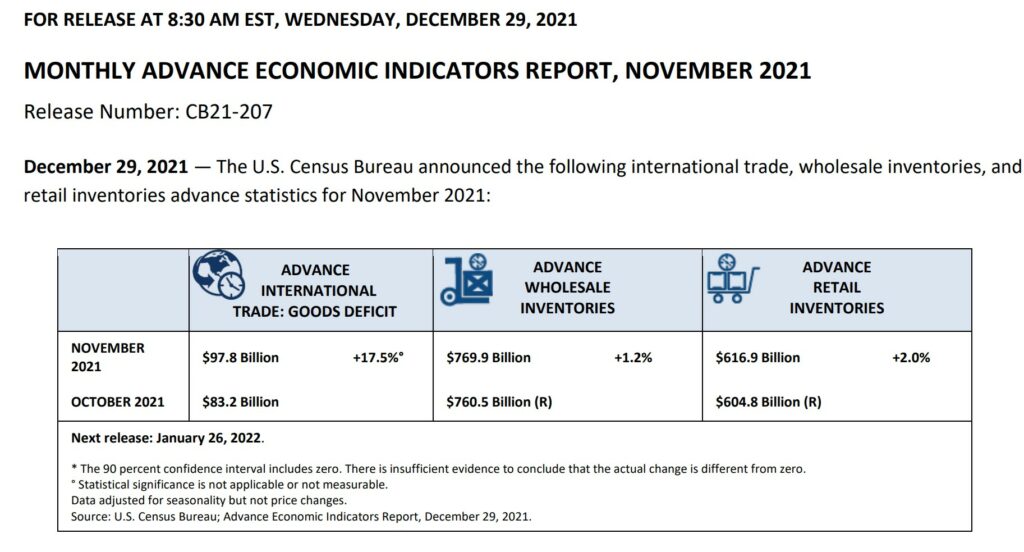
In addition to those regular reports, the Census Bureau released three “Advance Economic Indicators” this week, which are sketchy estimates that have typically been released a day before the monthly GDP reports since 2016, & which are intended to give the Bureau of Economic Analysis a basis for their estimates of the related GDP components . . . the Advance U.S. International Trade in Goods, a one page pdf table, indicated that our trade deficit in goods increased to $97.8 billion in November from a revised $83.2 billion in October, as November’s exports of goods were valued at $154,655 million, $3,275 million lower than October’s goods exports of $157,930 million, while November’s imports of goods were valued at $252,433 million, $11,306 million higher than October’s $241,127 million goods imports value… meanwhile, the Advance Monthly Retail Inventories report indicated that retail inventories were valued at $616.9 billion at the end of November, up 2.0 percent (+/- 0.2%) from October’s $604.8 billion, after October’s revised inventories rose 0.3% from September, while the Advance Monthly Wholesale Inventories report indicated end-of-month wholesale inventories were valued at $769.9 billion, up 1.2 percent (+/- 0.4 percent) from October, after October’s revised inventories rose 2.5% from September . . . the details on and revisions to these advance estimates will be provided when the full reports are released in the coming weeks..

