What I like about this Issue-Brief is the use of terminology we see, not knowing what it means, and seeing a description or definition. I have added links so as to do a deeper dive into the terminology. Carefully read, a person can garner an understanding of initial drug costs, intermediate costs, discounts, and what pricing results to the consumer. It is not pretty and reflects much pricing rent-taking over the last two or so years, blaming inflation, even though profits were still exceptional. One should keep in mind, pharmaceuticals are a smaller percentage of healthcare costs. This brief does provide the acronyms and a definition coming by way of the usage of the terminology. As you can see the brief is from 2022. I will check around and see if
Topics:
run75441 considers the following as important: Education, Healthcare, Pharmaceuticals, US EConomics
This could be interesting, too:
NewDealdemocrat writes JOLTS revisions from Yesterday’s Report
Bill Haskell writes The North American Automobile Industry Waits for Trump and the Gov. to Act
Bill Haskell writes Families Struggle Paying for Child Care While Working
Joel Eissenberg writes Time for Senate Dems to stand up against Trump/Musk
What I like about this Issue-Brief is the use of terminology we see, not knowing what it means, and seeing a description or definition. I have added links so as to do a deeper dive into the terminology. Carefully read, a person can garner an understanding of initial drug costs, intermediate costs, discounts, and what pricing results to the consumer. It is not pretty and reflects much pricing rent-taking over the last two or so years, blaming inflation, even though profits were still exceptional. One should keep in mind, pharmaceuticals are a smaller percentage of healthcare costs.
This brief does provide the acronyms and a definition coming by way of the usage of the terminology. As you can see the brief is from 2022. I will check around and see if here is a later version too. The charts below are explanatory. The Data and Methods section provides good explanation how this plays out with Drug stores, PBMs, insurance companies, etc. the bandits of healthcare pharmaceutical costs and pricing.
Parts of this I changed. Much is the same and I would call a C&P. Pay attention to embolden and italicized sections. I did such to draw attention to the words and the resulting meaning.
“Price Increases for Prescription Drugs, 2016-2022,” Office of the Assistant Secretary for Planning and Evaluation, U.S. Department of Health & Human Services, Arielle Bosworth, Steven Sheingold, Kenneth Finegold, Nancy De Lew, Benjamin D. Sommers
Assistant Secretary for Planning and Evaluation (ASPE) to the Secretary of the Department of Health and Human Services. Duties of the ASPE include advising the Secretary of the Department of Health and Human Services on policy development in health, disability, human services, data, and science; and provides advice and analysis on economic policy. The ASPE also leads special initiatives.
Summation
Prescription drug price increases create affordability challenges for patients and for the government. This report tracks overall drug price changes from 2016-2022. There are sites which I read which get into the individual costs/pricing which I read; however, it is difficult to present here.
There were 1,216 products whose price increases during the twelve-month period from July 2021 to July 2022 exceeded the inflation rate of 8.5 percent for that time period. The average price increase for these drugs was 31.6%. Some drugs in 2022 increased by more than $20,000 or 500%. The Inflation Reduction Act introduced a requirement for manufacturers to pay rebates to Medicare for Part D drugs whose price increases exceed inflation. This began October 1, 2022. Its purpose by design is to reduce the frequency and size of drug price increases.
Key Points
- High prescription drug prices create affordability challenges for patients and the health care system. Among existing products, increases in average prices over time have added to these challenges.
- Most prescription drug price increases occur in either January or July each year, with the greatest number taking place in January. The number of increases in both months during 2022 was higher than in previous years.
- In January 2022, the average price increase was nearly $150 per drug (10.0 percent), and in July 2022, it was $250 (7.8 percent). The dollar increases were larger than for the same months in previous years.
- In 2022, several drugs increased list prices by more than $20,000 or by more than 500 percent.
- There were 1216 products whose price increases during the twelve-month period from July 2021 to July 2022 exceeded the inflation rate of 8.5 percent for that time period. The average price increase for these drugs was 31.6 percent.
- The Inflation Reduction Act introduces a new requirement for manufacturers to pay rebates to Medicare for Part D drugs whose price increases exceed inflation, beginning October 1, 2022, which was designed to reduce the frequency and size of drug price increases.
Overview
Making prescription drugs affordable for Americans has been a priority for the Biden-Harris Administration, as described in the Comprehensive Plan to Address Drug Pricing released in September 2021. Americans regularly pay far more for prescription drugs than do patients in other comparable countries. A recent study found that 2018 U.S prescription drug prices were 2.56 times those in 32 comparable countries, and 1.90 times as high when rebates and other discounts are taken into account. The United States spends more on prescription drugs on a per capita basis than other countries in the Organization for Economic Co-operation and Development (OECD).
The Inflation Reduction Act (IRA) signed by President Biden on August 16, 2022, included multiple provisions to address high and rising drug prices. One provision in the new law requires the federal government to negotiate prices for selected high-cost drugs covered under Medicare. Another provision requires drug manufacturers to pay rebates to Medicare if they enact price increases greater than inflation for drugs utilized by Medicare beneficiaries. This provision goes into effect for price increases made in the 12-month period beginning October 1, 2022, for Part D drugs and January 2023 for Part B drugs.
The objective of this report is to describe changes in prescription drug prices that have occurred between 2016 and 2022. Continuous tracking of price changes can inform drug pricing policies, such as those to be implemented under the IRA. This report focuses on list prices, which can be distinguished from net prices. List prices are those prices set by manufacturers, which determine what a patient pays at the pharmacy. Net prices account for rebates that are paid directly to pharmacy benefit managers (PBMs) and plans after the fact. Rebates as a percent of total drug spending have grown in recent years from 11.7 percent in 2012 to a projected 32.5 percent in 2022. While net prices are important components of drug and health spending, it is also critical to track list prices, since patient out-of-pocket liability – whether coinsurance or copayment – generally grows as list prices increase. * Rapidly rising list prices can also place greater burdens on those paying fully out-of-pocket such as uninsured individuals.
Data and Methods
The primary data source for this report is AnalySource. Manufacturers report their price changes at the National Drug Code (NDC) level to independent databases known as pricing compendia. The vendors aggregate this information for purchasers, such as distibutors, wholesalers (PBMs), pharmacies, and hospitals. These databases are available for purchase under subscription licenses allowing for daily updates. AnalySource is one such pricing compendia database. Product is defined as a grouping of National Drug Codes (NDCs) having the same active ingredient and being sold by the same labeler.
AnalySource data provides daily updates on list price changes for millions of products (including drugs covered under Medicare Part B and D). It also includes information on product type, marketing status, drug class, and drug indication. This combination of information gives flexibility to rapidly analyze general market trends or to isolate and examine individual markets.
For this analysis, price is defined as the Wholesale Acquisition Cost (WAC) of a given product at the package unit level; package size is the number of billing units in the labeled quantity from which the pharmacist typically dispenses(which would often be a 100-day supply for a chronic medication, or a shorter course for an antibiotic regimen, for instance). ‡ WAC, as published by First Databank, represents the manufacturer’s published catalog or list price for a drug product to wholesalers as reported to First Databank by the manufacturer. The term “manufacturer” in this context includes repackagers, private labelers and other suppliers. WAC does not represent actual transaction prices and does not include discounts, rebates, or other reductions in price.
The retail price of a drug at the pharmacy counter is determined by negotiations between pharmacies and insurers (or their PBMs) and reflects both wholesale and retail markups. Those markups compensate the wholesaler and pharmacy, respectively, for the services they provide and for their inventory costs. The retail price of a given drug is generally similar for most payers (public and private insurers and cash-pay patients), according to an analysis by the Congressional Budget Office. Consumers who have not yet satisfied their insurance plan’s annual deductible pay the retail price, or possibly less if the manufacturer has a discount program for that drug and the consumer is eligible for the program. Consumers with health insurance who have met their deductible pay only a portion of the retail price, as specified by their plan’s copayment or coinsurance schedule; the remainder is paid by their plan or its PBM. Consumers without insurance may pay a pharmacy’s “usual and customary” price. This tends to be higher than the net prices paid by other payers — or may pay a lower amount using a manufacturer discount program.
We first examined all price increases at the NDC level occurring in January and July of 2022. We chose these months because historically they account for most of the increases that occur each year. We then focused on drugs with substantial price changes, using the following criteria:
- Drugs with price changes greater than $20 per package reflecting at least a 10 percent change within a 12-month period.
OR - Any change in price greater than $500 per package (even if that amount reflected less than a 10 percent change).
We described any price change meeting these criteria as a “significant price change,” and this was our primary study outcome. All price changes were in nominal terms and were not adjusted for inflation.
Analysis Results
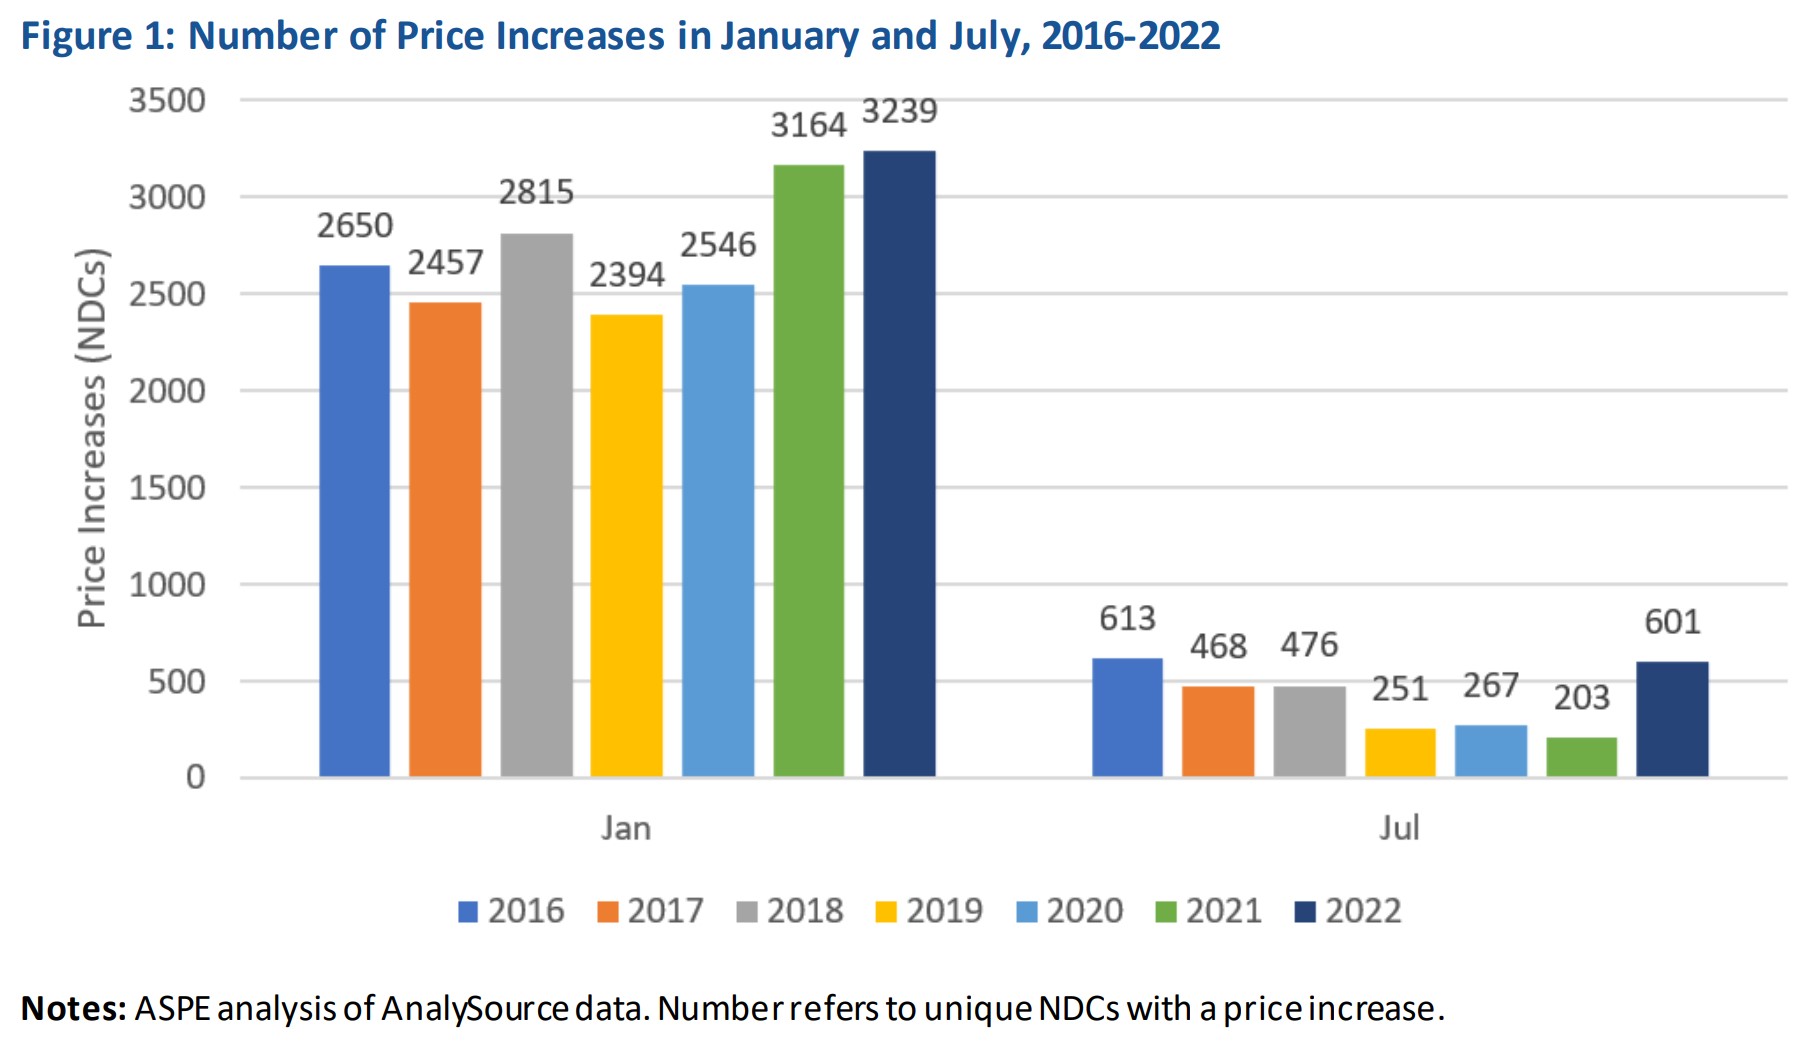
Figure 1 displays the count of prescription drug NDCs experiencing any increase in price during January and July each year, 2016 to 2022. Most price increases occur at the beginning of January, with more than 3000 drugs experiencing a price increase in 2022, up from 2650 in 2016. The number of July price increases trended downward from 613 NDCs in 2016 to 203 in 2021, but in July of 2022, the number of increases rose to a level similar to that observed in 2016, with 601 increases. The AnalySource dataset includes 111,871 active NDC codes, meaning . . . in 2022, 3.4 percent of NDCs experienced a price increase in January or July.
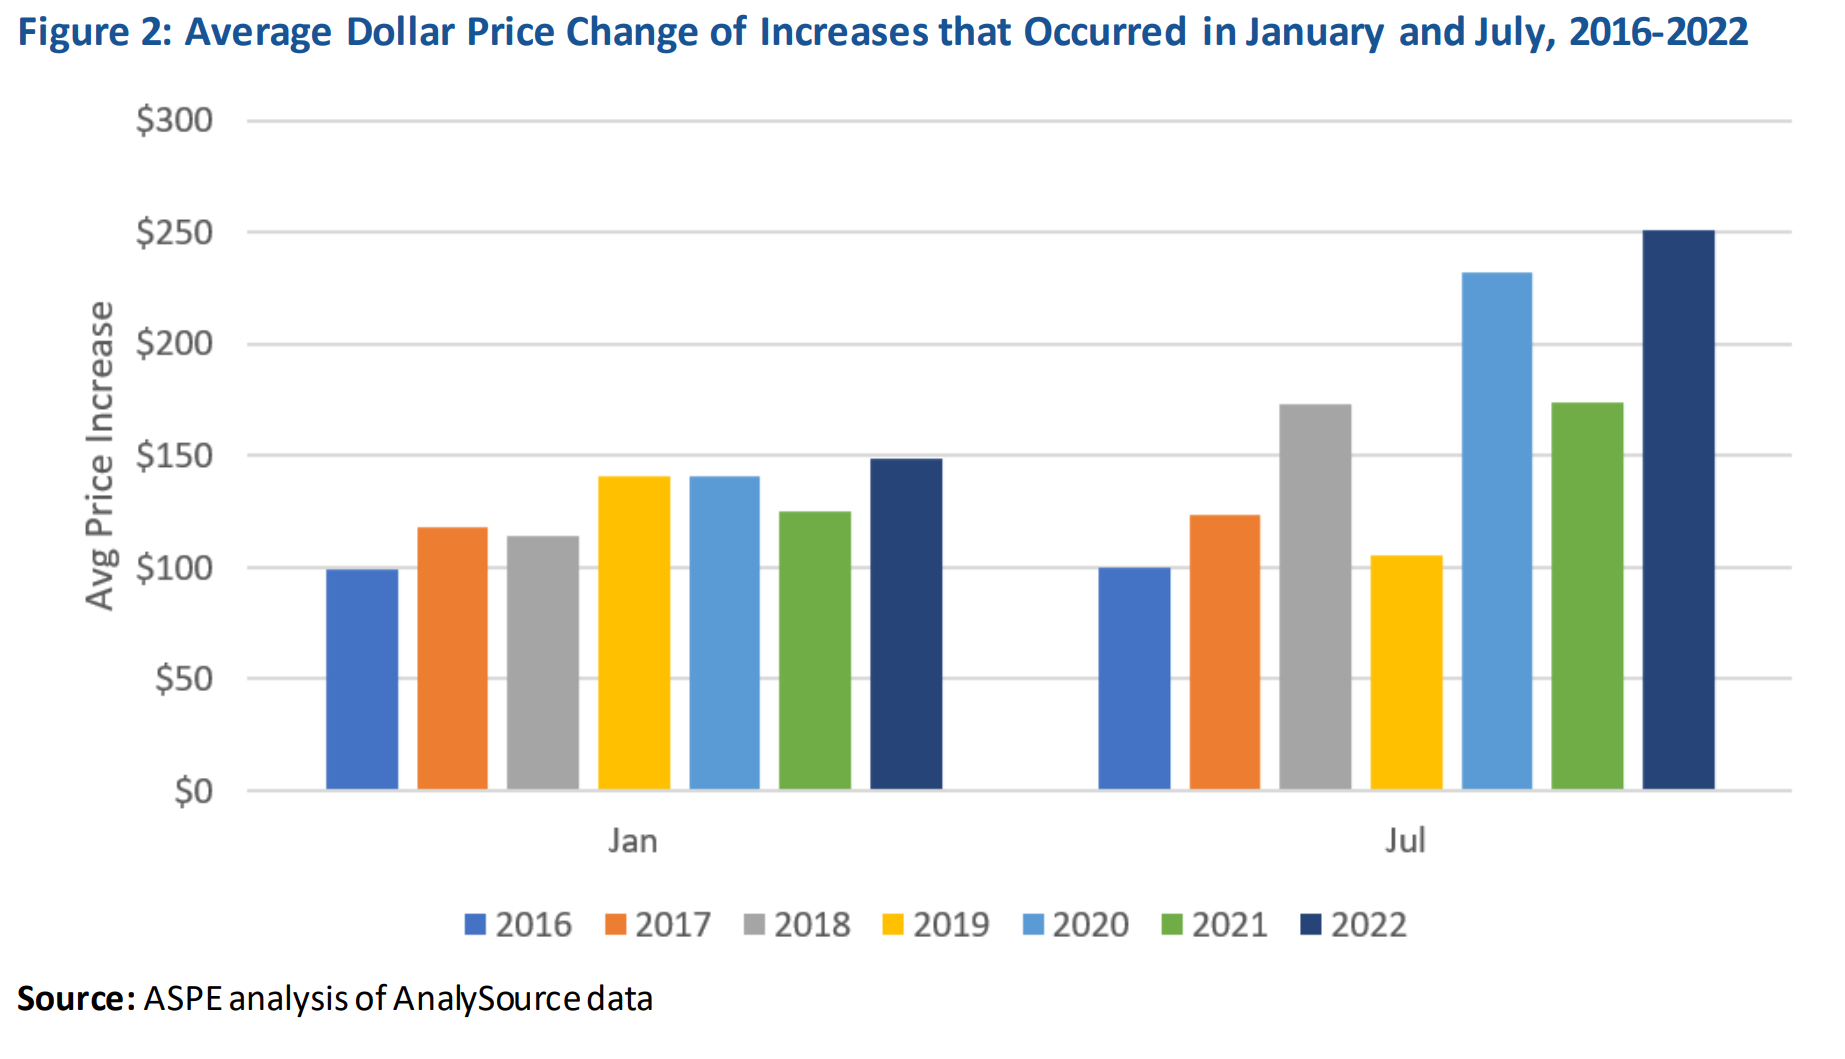
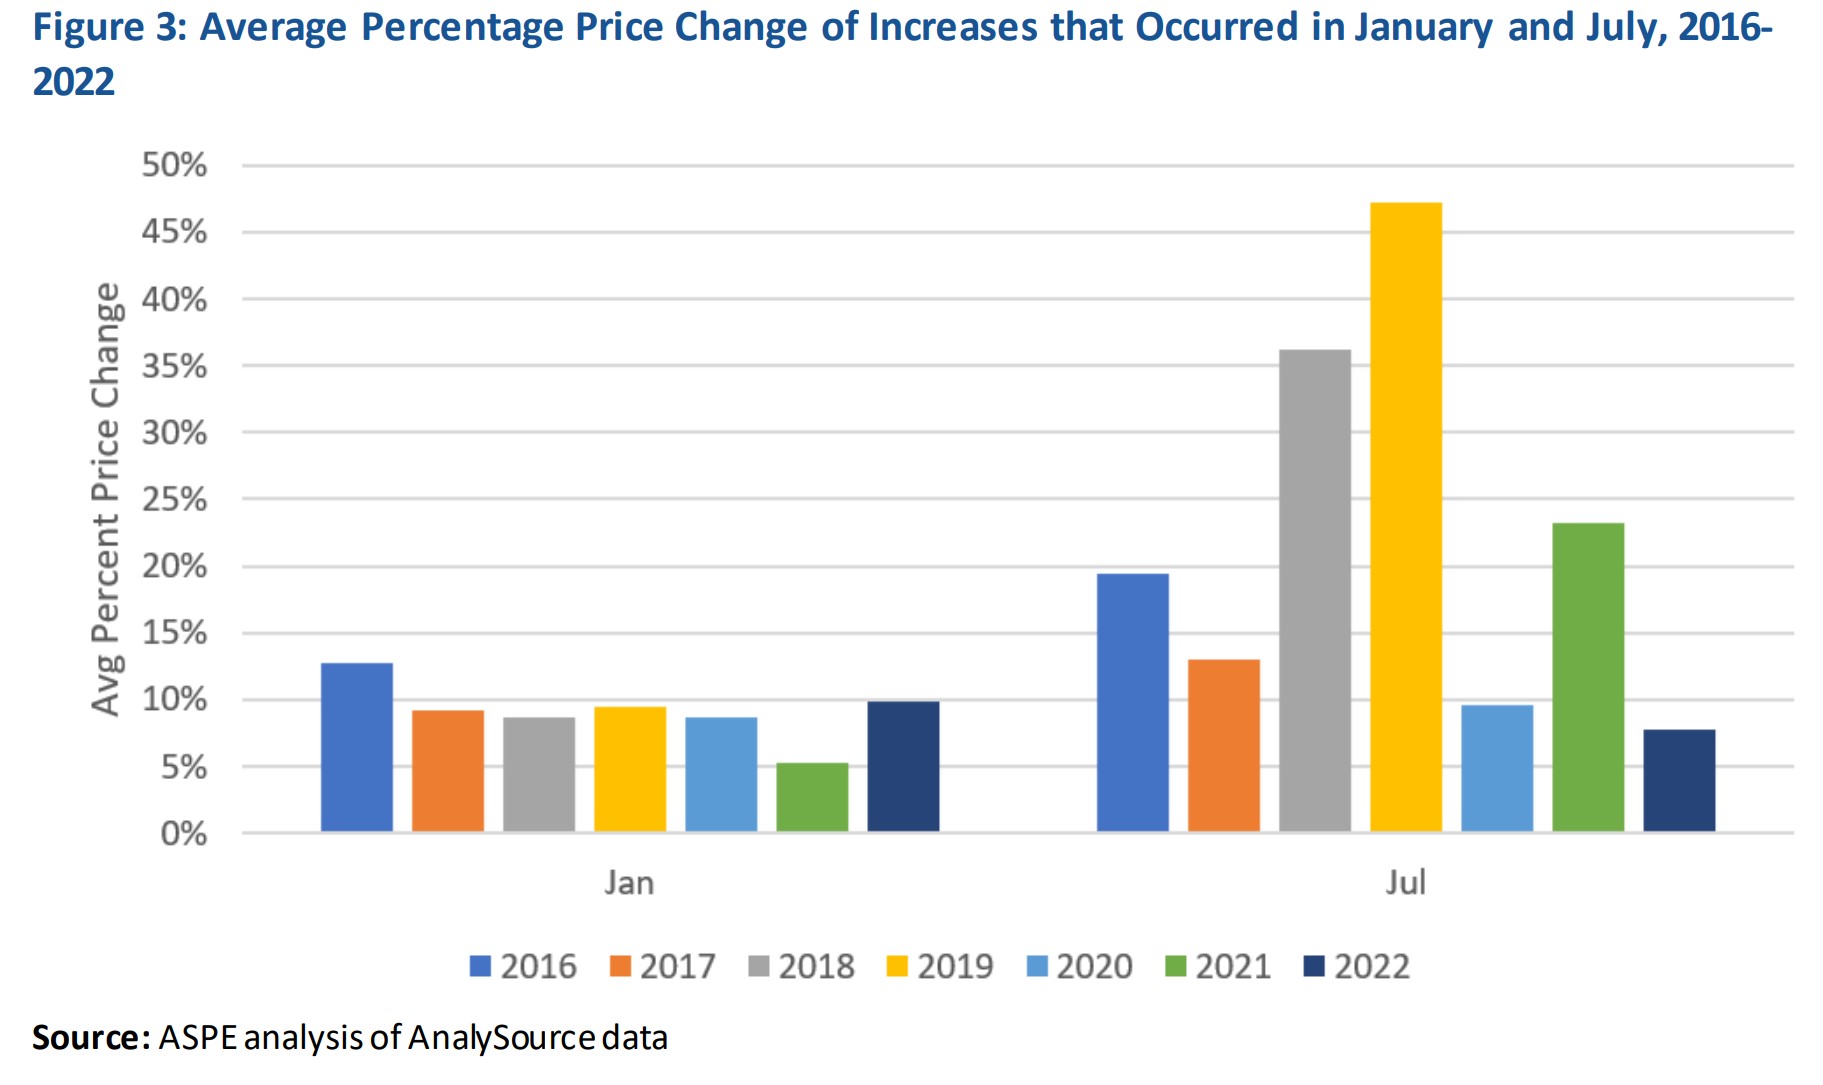
Figures 2 and 3 show the average size of those prices increases. In January 2022, the average price increase was nearly $150 per drug (10 percent), and in July 2022, it was $250 (7.8 percent). July increases tended to be for higher priced drugs than those in January, resulting in higher dollar increases but smaller percentage increases.
Results in 2022 were affected in part by the high recent rate of general inflation. The Consumer Price Index for all Urban Consumers (CPI-U) increased by 8.5 percent between July 2021 and July 2022. While the average July 2022 price increase (7.8 percent) was slightly below the rate of inflation, 124 of the 601 increases taking place in July exceeded general inflation. Moreover, there were 1216 NDCs whose price increases during the twelve-month period July 2021 to July 2022 exceeded 8.5 percent. The average price increase for these drugs was 31.6 percent
Drugs with Significant Price Increases
Not all price changes are large, and some updating of prices to account for inflation over time is to be expected. Thus, using the thresholds described above, we also identified the share of price changes in January and July 2022 that met our criteria for “significant price increases.” Of the over 3000 price increases in January, 241 exceeded the greater than 10 percent and $20 threshold, while 248 exceeded the $500 threshold. Of the 601 price increases in July, 43 and 66 exceeded these thresholds respectively. Combined, these results indicate that 15-18 percent of price increases in those two months were significant increases, based on our study criteria.
Tables 1 and 2 provide details for drugs with the largest price increasesin January or July of 2022, either in dollars or percentage terms, respectively. All the drugs in Table 1 increased in list price by thousands of dollars, and in percentage terms, several drugs in Table 2 increased their prices by more than 500 percent. Note these tables omit multiple entries for the same drugs from the same labeler, as often price changes occur at the same time for multiple dosages and packaging for the same product. Cancer treatments represented the majority of the drugs in Table 1, while the medications in Table 2 were more varied.


Some Comments
Pres. Joe Biden’s IRA includes several provisions to address both high prices in particular drugs and large prices increases. In this Issue-Brief, the price increases were examined occurring from 2016 to 2022 and focused on those that
were of the greatest magnitude. Large price changes – totaling tens of thousands of dollars, or in some cases more than quintupling the price – occurred in 2022. IRA policies may slow the rate of price increases for drugs, beginning with the new rebate period beginning October 1, 2022. In future reports theASPE will continue to assess trends in price increases over time.
Understanding Drug Pricing, uspharmacist.com, Joey Mattingly