{bit.ly/dsia07c} Lecture 7 examines methods of establishing association, or lack of it, between two variables. This part C shows how we establish the strong relationship between consumptions and incomes using the World Bank WDI panel data set of 132 countries over 60 years. We examine the same problem in isolation for a single country, and …
View moreVideos by Asad Zaman
Export Led Growth?
bit.ly/dsia07b – Part b of Lecture 7, Descriptive Statistics: An Islamic Approach. World Bank WDI data set for exports and growth is analyzed. The data show clearly that there is no relationship between the two variables. This shoots down the Export-Led Growth Hypothesis.
View moreExports and Growth: Preliminary Considerations
bit.ly/DSIA07A: Part A of lecture 7 on Descriptive Statisics: An Islamic Approach. Introductory discussion of concepts of causation, correlation, and association. Selection and examination of relevant export and GDP growth series from the WDI data set of the World Bank.This is preliminary to examination of the Export-Led Growth hypothesis in the next part of this …
View moreComparisons, Benchmarks, and Confounding Factors
(bit.ly/dsia06f} Part F of Lec 6 explains that comparisons require benchmarks. It is important that the benchmarks should be “comparable” in the right way with the cases under evaluation. In statistical language, this is called the Treatment and Control group. For comparability, it is essential that the two groups should be matched on the “confounding …
View moreComparing Progress of Countries on Infant Mortality
bit.ly/dsia06e – part E of Lec 6 Descriptive Statistics: An Islamic Approach. Explains how rankings depend on purpose. We can compare countries to find which ones used good strategies for reduction in Infant Mortality. A number of criteria are discussed, and best countries are individually analyzed and evaluated. For the full online coures, see https://portal.alnafi.com/courses/descriptive-statistics
View moreEvolving Distribution of Infant Mortality
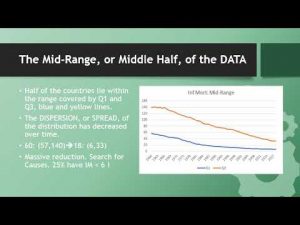
bit.ly/dsia06d – Part D of Lec 6 on Descriptive Statistics: An Islamic Approach. Discusses how the distribution of IM has changed over time, and remarkable decreases which have taken place. The graphical methodology of the five-point summary created by the five quartiles Q0, Q1, Q2, Q3, Q4 is explained in detail, and how this can …
View moreStochastic Relationships
[bit.ly/dsia06c] Part C of Lec 6 on Descriptive Statistics: An Islamic Approach. Stochastic relationships relate one variable X to the DISTRIBUTION of the other variable Y, and not the the variable Y itself. This makes it difficult to understand the concept, because it operates at the group level, not on a case by case basis. …
View moreQuartiles as Natural Data Summaries
[bit.ly/dsia06b] Part B of Lec 6 on Descriptive Statistics: An Islamic Approach. The basis of REAL statistics is the actual data distribution. This contrasts with Fisherian Statistics, which makes a hypothetical imaginary theoretical distribution the center of investigation. Natural summary statistics for the actual data distribution are the quartiles. What these are and how they …
View moreDo the Rich Have Fewer Children?
bit.ly/dsia06a Part A of Lec 6 on Descriptive Statistics: An Islamic Approach. We analyze the HIES (Household Income and Expenditure Survey) to see if it shows that wealthier households have fewer children. If we take Total Expenditure as a proxy for Wealth, the answer is no. But this is the wrong proxy. When we switch …
View moreContrast Between Real & Fisherian Statistics: Inflation Example
bit.ly/dsia05e Part E of Lec 5 Descriptive Statistics: Islamic Approach. Previous portions of lecture explained fundamental flaws of Fisherian approach to Statistics. This portion illustrates the dramatic differences between Fisher’s approach and Real Statistic within context of a study of Inflation and Money Growth for Australia
View moreReal Statistics: contrast with Fisher’s approach
bit.ly/dsia05d – Part D of Lec 5 on Descriptive Statistics: An Islamic Approach. Sir Ronald Fisher developed an approach to statistics based on data reduction because computational limitations made it impossible to directly analyze large amounts of data. Advances in computational capabilities have made this approach obsolete and irrelevant. This lecture articulates and outlines the …
View moreSir Ronald Fisher’s Failings and the Foundations of Statistics
bit.ly/dsia05c – Part C of Lec 5 Descriptive Statistics: An Islamic Approach. Do its Eugenic foundations affect modern statistics? We consider the personality of Sir Ronald Fisher, and his wrong stance in a number of statistical controversies. His personal victories created losses for the discipline which was built on the wrong foundations. That is why …
View moreHow to Launch an Islamic Revival?
Outline of Online Course – Islamic teachings created a revolution 14 centuries ago, catpulting ignorant and backwards Bedouin to world leadership. The secret of this amazing success was the transformation of human beings. Why are Muslims failing to take advantage of the revolutionary teachings of Islam, and what are the steps need to launch an …
View moreGalton: Founder of Eugenics & Statistics
bit.ly/dsia05b Part B of Lec 5 Descriptive Statistics: An Islamic Approach. Describes the racist ideas of Sr Francis Galton, and how the attempt to verify and validate them led to the creation of the statistical tools/methods of correlation. These methods are deeply flawed, as later lectures will show, because they can be used to prove …
View moreMalthusian Influence on Foundations of Statistics
bit.ly/dsia05a – Part A of Lec 5 Descriptive Statistics: An Islamic Approach. Describes how Malthus thought poverty was hereditary, and like an incurable disease. As a result, he advocated sterlization and extermination of the poor, as the cure for poverty. These ideas evolved to create the foundation for Eugenics, which was closely tied to the …
View moreMalthus, Racism, and Poverty
Alternate bit.ly/dsia05AA – Lecture describes Malthusian approach to poverty. This led to the field of Eugenics, which had a tremendous influence on the creation of statistics. The lecture nominates Malthus as the individual responsible for creating the greatest amount of human misery, ahead of traditional candidates like Hitler, or Genghis Khan.
View moreQuantity Theory of Money Fails on Australian Data
bit.ly/dsia04g – Part G of Lec 4 on Descriptive Statistics: An Islamic Approach. Previous lec set up the theoretical framework for study of inflation in context of QTM. This lecture assesses QTM on Australian data on Money, Prices, and GDP, using World Development Indicators (WDI) Data Set from the World. The theory clearly fails to …
View moreInflation in Macroeconomic Theory
bit.ly/dsia04f – Part F of Lec 4 on Descriptive Statistics: An Islamic Approach. Previous lectures have explore calculation of inflation as impact of price change on household budgets. This and next lecture explore inflation in relation to the Quantity Theory of Money as a Macroeconomic Hypothesis. This lecture provides introduction to the theoretical background and …
View moreFear of Big Data: Multiple Inflations
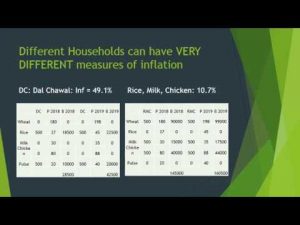
bit.ly/dsia04e Part E of Lec 4 of Descriptive Statistics: An Islamic Approach, explains how inflation rate varies by household, depending on consumption pattern. Generally speaking, one cannot reduce all of these inflation numbers to ONE number – the inflation rate -without serious loss of information. A histogram captures most of the information in the data …
View moreComposite Commodities: Laspayre’s and Paasche Indices
bit.ly/dsia04d – Part D of Lecture 4 on Descriptive Statistics: An Islamic Approach – A price index is a the price of a composite commodity, which is a particular basket of goods. Inflation can be measured by price changes of this composite commodity. How do we choose proportions of goods within the composite commodity. Laspayre …
View moreComputing Sensitive Price Index and Inflation
bit.ly/dsia04c Part C of Lec 4 on Descriptive Statistics: An Islamic Approach, explains some philosophical aspects of data reduction and simplification. Then it discusses the details of how a price index is constructed, and how it is used to compute inflation. This is done in context of the Sensitive Price Index for Pakistan.
View moreInflation: Reducing Data to ONE Number
bit.ly/dsia04b – Part B of Lec 4 on Descriptive Statistics: An Islamic Approach. The general concept of data reduction is based on making theoretical assumptions which allow us to reduce data to a few sufficient statistics. There is no justification, other than mathematical and computational convenience, for these assumptions. We discuss whether or not it …
View moreReflections on my MIT Education – 1
bit.ly/mit4az1 – Talk explains how my MIT education was purely technical and completely ignored the most important questions we all face in our lives. Why does modern education bypass the big questions, which we need to learn about, in order to lead rich and meaningful lives?
View moreWhy an “Islamic Approach” to Statistics?
bit.ly/dsia04a – Part A of 4th Lec on Descriptive Statistics: An Islamic Approach revisits the question of why we need an “Islamic Approach” to an apparently objective and neutral subject like statistics. The critical issue is the PURPOSE of study, which must be related to the purpose of our lives. What kind of knowledge is …
View moreProbability Histograms & Cumulative Distribution
bit.ly/dsia03f Part F of Lec 3 of Descriptive Statistics: An Islamic Approach explains a probability or percentage histogram, which is slightly different from the count histogram, discussed in previous portions of this lecture 3. The concepts of random choice, random variable, and CDF – cumulative distribution function of a random variable – are described and …
View moreHistograms with Varying Bin Sizes
bit.ly./dsia03e Part E of Lec 3 on Descriptive Statistics: An Islamic Approach. Lec 3 is about histograms as a picture of the data. This part E explains how bin sizes affect the shape of the histogram. It showsthat we get more detailed information as the bin size becomes smaller, but the noise also increases, making …
View moreHistograms of World Bank Life Expectancy Data
bit.ly/dsia03d Part D of Lecture 3, Descriptive Statistics: An Islamic Approach. Explains the concept of histograms and how they can be used to visualize large amounts of data. Histograms of WDI Life Expectancy Data are created and analyzed to learn how LE has behaved over time and across countries.
View moreAnalyzing World Bank WDI Life Expectancy Data
bit.ly/dsia03c Part C of Lecture 3 on Descriptive Statistics: An Islamic Approach. This lecture begins the analysis of the WDI Data Set on Life Expectancies. It explains the importance of benchmarks for comparison, and also the purpose of data analysis.
View moreComputing Life Expectancy from Mortality Tables
bit.ly/dsia03b Part B of Lecture 3 on Descriptive Statistics: An Islamic Approach goes through basic steps required in computing life expectancies from mortality tables. It also explains the meanings of the number involved, as well as the assumptions on which the calculations are based.
View moreLife Expectancies: Introduction and Basics
bit.ly/dsia03a – Part A of 3rd Lecture on Descriptive Statisics: An Islamic Approach. There are many different types of numbers, many of which are misleading and deceptive because they mix facts and values. Life Expectancy is a purely objective numerical measure of external reality, which does not depend on biases and values of the observer. …
View more
