Figure 1: A Two-Dimensional Pattern Diagram The example in this working paper is of an economy in which two commodities are produced. Technical progress is modeled as decreasing the coefficients of production in one of the processes for producing corn. They decrease at a rate of σ of ten percent. Figure 2 shows how the pattern of switch points vary with technical progress. Initially, the Beta technique is cost-minimizing. Then it becomes a reswitching example. Around the switch point at the lower rate of profits, a higher wage is associated with more labor being hired, per unit of net output. Also, a higher wage is associated with the adoption of more direct labor being hired in corn production, per bushel corn produced gross. This is called a reverse substitution of labor. The other
Topics:
Robert Vienneau considers the following as important: Example in Mathematical Economics, Full Cost Prices, Labor Markets, Sraffa Effects
This could be interesting, too:
Robert Vienneau writes Austrian Capital Theory And Triple-Switching In The Corn-Tractor Model
Robert Vienneau writes Double Fluke Cases For Triple-Switching In The Corn-Tractor Model
Robert Vienneau writes The Emergence of Triple Switching and the Rarity of Reswitching Explained
Robert Vienneau writes Recap For A Triple -Switching Example

|
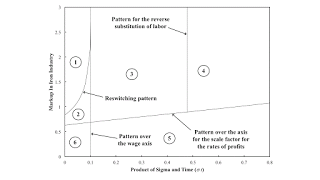
| Figure 1: A Two-Dimensional Pattern Diagram |
The example in this working paper is of an economy in which two commodities are produced. Technical progress is modeled as decreasing the coefficients of production in one of the processes for producing corn. They decrease at a rate of σ of ten percent.
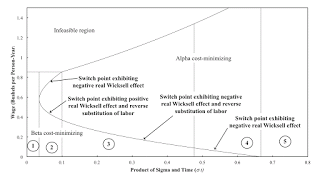
Figure 2 shows how the pattern of switch points vary with technical progress. Initially, the Beta technique is cost-minimizing. Then it becomes a reswitching example. Around the switch point at the lower rate of profits, a higher wage is associated with more labor being hired, per unit of net output. Also, a higher wage is associated with the adoption of more direct labor being hired in corn production, per bushel corn produced gross. This is called a reverse substitution of labor. The other switch point disappears over the wage axis with more technical progress. The remaining switch point still exhibits a reverse substitution of labor. Eventually, that switch point no longer exhibits such a reverse substitution. Finally, it disappears entirely.

|
| Figure 2: A Pattern Diagram |
I have been exploring how this example behaves with full cost pricing. I let the rate of profits in the iron industry be s1r, and the rate of profits in the corn industry be s2r. Figure 1 illustrates how these modeling choices for technical progress and markup pricing interact when s2 = 1.
Figure 2 illustrates the characteristics of switch points along a horizontal line, at s1, in Figure 1. The numbered areas in the two figures correspond. Only one switch point exists in the region numbered 6, and it has a positive real Wicksell effect.
The example illustrates that an increase in the markup in a specific industry can result in the creation of a switch point in which higher wages are associated with firms wanting to employ more workers, both per unit net output in the economy as a whole and per unit gross output in a specific industry. Think of a vertical line going through Regions 6, 2, and 1, and, specifically, the partition between Regions 6 and 2. On the other hand, the transition from Region 5 to Region 3 is associated with creation of a switch point that only exhibits a reverse substitution of labor; it still has a negative real Wicksell effect.
Thanks to the comments of Sturai for encouraging me to write this post and for pointing out a paper by Antonio D'Agata that I'll have to read.
 Heterodox
