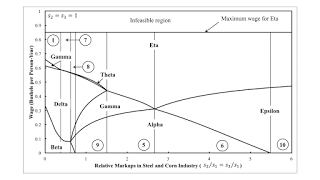
Figure 1: Switch Points Varying With Perturbations In Markup In Iron Industry I have created an example with three produced commodities and a choice of technique. The three produced commodities are called iron, steel, and corn. Corn is taken to be the numeraire and the only commodity purchased by households for consumption. Markups are assumed to vary among industries, even when prices of production prevail. I was able to locate various fluke switch points in that example. The fluke switch points partition the space of relative markups, as shown in Figure 2. Consider a 45 degree line in this space sloping upward, with s3/s1 equal to s2/s1. This corresponds to perturbing the markup in the iron industry, with unchanged markups in the steel and corn industries. Figue 1, at the top of this
Topics:
Robert Vienneau considers the following as important: Example in Mathematical Economics, Full Cost Prices, Sraffa Effects
This could be interesting, too:
Robert Vienneau writes Austrian Capital Theory And Triple-Switching In The Corn-Tractor Model
Robert Vienneau writes Double Fluke Cases For Triple-Switching In The Corn-Tractor Model
Robert Vienneau writes The Emergence of Triple Switching and the Rarity of Reswitching Explained
Robert Vienneau writes Recap For A Triple -Switching Example
| Figure 1: Switch Points Varying With Perturbations In Markup In Iron Industry |
I have created an example with three produced commodities and a choice of technique. The three produced commodities are called iron, steel, and corn. Corn is taken to be the numeraire and the only commodity purchased by households for consumption. Markups are assumed to vary among industries, even when prices of production prevail.
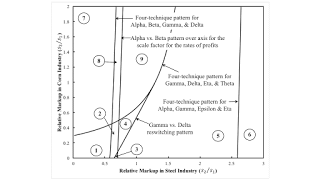
I was able to locate various fluke switch points in that example. The fluke switch points partition the space of relative markups, as shown in Figure 2. Consider a 45 degree line in this space sloping upward, with s3/s1 equal to s2/s1. This corresponds to perturbing the markup in the iron industry, with unchanged markups in the steel and corn industries. Figue 1, at the top of this post shows the location of switch points and the maximum wage, as the markup in the iron industry varies.
| Figure 2: Partitions in the Space of Relative Markups |
I make a few points about the graph of the wage at switch points, as the relative markup in the iron industry varies. The markup in the iron industry declines to the right. The partitions between regions 1 and 7 and between regions 9 and 5 are a four-technique pattern of switch points for the Gamma, Delta, Theta, and Eta techniques. Notice that a switch point between the Delta and Gamma techniques exists in both region 1 and in regions 8 and 9. Around this switch point in region 1, a higher wage is associated with the Gamma technique becoming cost-minimizing. Around the corresponding switch points in regions 8 and 9, a higher wage is associated with the Delta technique becoming cost-minimizing. The amount of labor hired throughout the economy for a given technique and given net output is a physical property of the coefficients of production; this measure of labor intensity is independent of wages. In this case, firms want to hire more labor per bushel corn produced net with a higher wage around this switch point in regions 8 and 9. In this sense, the switch point between the Gamma and Delta techniques is 'non-perverse' in region 1 and 'perverse' in regions 8 and 9. (I here call a switch point 'perverse' merely if it does not follow obsolete marginalist dogma.)
I do not think I have previously noted that the areas in which a technique, like Gamma, is cost-minimizing can be disconnected in certain projections, such as Figure 1.
 Heterodox


