Figure 1: Variation of Switch Points with the Markup in the Steel Industry1.0 Introduction I want to continue to analyze this example. This example does not do everything I would like with a three-commodity example. Specifically, I do not have a case of triple-switching in the parameter space I explore in this post. That space of relative markups, in a model with n industries, has (n - 1) dimensions. And it is partitioned by (n - 2)-dimensional manifolds, where each manifold corresponds to a fluke switch point. Whether or not reswitching, capital-reversing, or the recurrence of techniques exist depends on relative markups. This post illustrates in an example with three produced commodities. 2.0 Technology This economy produces a single consumption good, called corn. Corn is also a
Topics:
Robert Vienneau considers the following as important: Example in Mathematical Economics, Full Cost Prices, Sraffa Effects
This could be interesting, too:
Robert Vienneau writes Austrian Capital Theory And Triple-Switching In The Corn-Tractor Model
Robert Vienneau writes Double Fluke Cases For Triple-Switching In The Corn-Tractor Model
Robert Vienneau writes The Emergence of Triple Switching and the Rarity of Reswitching Explained
Robert Vienneau writes Recap For A Triple -Switching Example
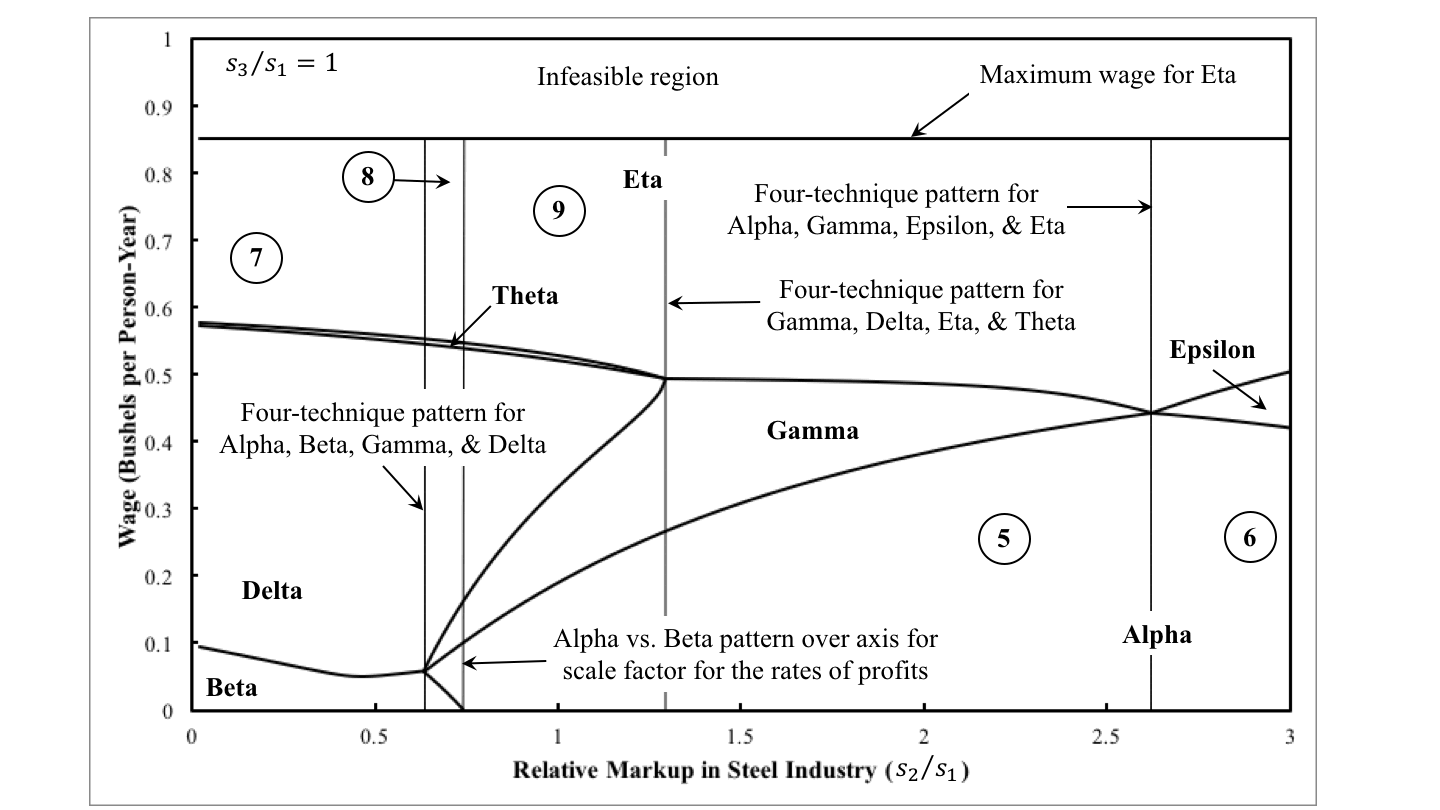 |
| Figure 1: Variation of Switch Points with the Markup in the Steel Industry |
I want to continue to analyze this example. This example does not do everything I would like with a three-commodity example. Specifically, I do not have a case of triple-switching in the parameter space I explore in this post. That space of relative markups, in a model with n industries, has (n - 1) dimensions. And it is partitioned by (n - 2)-dimensional manifolds, where each manifold corresponds to a fluke switch point. Whether or not reswitching, capital-reversing, or the recurrence of techniques exist depends on relative markups. This post illustrates in an example with three produced commodities.
2.0 TechnologyThis economy produces a single consumption good, called corn. Corn is also a capital good, that is, a produced commodity used in the production of other commodities. In fact, iron, steel, and corn are capital goods in this example. So three industries exist. One produces iron, another produces steel, and the last produces corn. Two processes exist in each industry for producing the output of that industry. Each process exhibits Constant Returns to Scale (CRS) and is characterized by coefficients of production. Coefficients of production (Table 1) specify the physical quantities of inputs required to produce a unit output in the specified industry. All processes require a year to complete, and the inputs of iron, steel, and corn are all consumed over the year in providing their services so as to yield output at the end of the year.
| Input | Iron Industry | Steel Industry | Corn Industry | |||
| a | b | c | d | e | f | |
| Labor | 1/3 | 1/10 | 5/2 | 7/20 | 1 | 3/2 |
| Iron | 1/6 | 2/5 | 1/200 | 1/100 | 1 | 0 |
| Steel | 1/200 | 1/400 | 1/4 | 3/10 | 0 | 1/4 |
| Corn | 1/300 | 1/300 | 1/300 | 0 | 0 | 0 |
A technique consists of a process in each industry. Table 2 specifies the eight techniques that can be formed from the processes specified by the technology. If you work through this example, you will find that to produce a net output of one bushel corn, inputs of iron, steel, and corn all need to be produced to reproduce the capital goods used up in producing that bushel.
| Technique | Processes |
| Alpha | a, c, e |
| Beta | a, c, f |
| Gamma | a, d, e |
| Delta | a, d, f |
| Epsilon | b, c, e |
| Zeta | b, c, f |
| Eta | b, d, e |
| Theta | b, d, f |
I now want to consider prices when firms in each industry are making the going rate of profits in that industry, given the relative markups among industry. To start, I assume that a single process is operated in each industry. In other words, I initially take the technique is given. So the iron industry is characterized by:
- a0,1: The person-years of labor hired each year, per ton iron produced.
- a1,1: The tons of iron used as input, per ton iron produced.
- a2,1: The tons of steel used as input, per ton iron produced.
- a3,1: The bushels corn used as input, per ton iron produced.
Similiar coefficients of production, with the second coefficient varying by industry, characterize the steel and corn industries. They can be read off columns in Table 1 for the the processes comprising the given technique.
| Variable | Definition |
| p1 | Price of iron (bushels per ton iron) |
| p2 | Price of steel (bushels per ton steel) |
| w | Wage (bushels per person-year) |
| s1 | Markup in iron industry |
| s2 | Markup in steel industry |
| s3 | Markup in corn industry |
| r | Scale factor for rates of profits |
To formulate the price equations, for a given technique, I need the variables listed in Table 3. The price equations for the iron, steel, and corn industries are, respectively:
(p1a1,1 + p2a2,1 + a3,1)(1 + r s1) + w a0,1 = p1
(p1a1,2 + p2a2,2 + a3,2)(1 + r s2) + w a0,2 = p2
(p1a1,3 + p2a2,3 + a3,3)(1 + r s3) + w a0,3 = 1
The left-hand side of each of these equations shows the costs of producing one physical unit of the output of the corresponding industry. Capital goods are charged with the going rate of profits on them, and wages are paid out at the end of the year. The right-hand side of these equations shows the corresponding revenues. The equations show that revenues cover costs. No extra profits are made in any industry.
4.0 The Choice of TechniqueGiven markups, the prices equations for a technique can be solved to find the wage, the price of a ton iron, and the price of a ton steel as a function of the scale factor for the rate of profits. Figure 1, at the top of this previous post illustrates wage curves for a specific set of markups in the three industries. The cost-minimizing technique(s) contributes its wage curve to the outer envelope for those wages or scale factors at which it is cost-minimizing. The usual mathematics drawn on in post Sraffian price theory applies even outside of competitive markets, given relative markups among industries.
5.0 Perturbations of MarkupsFluke switch points partition the space of relative markups among industries, as is illustrated in Figure 2. Within each numbered region, the number and sequence of switch points along the wage frontier does not vary, although their specific location does. Table 4 lists the cost-minimizing techniques in each region, in order of an increasing wage. Some partitions exist that are not shown in Figure 2, with corresponding regions not listed in Table 4. Somewhere to the right of Figure 2, there exists a Epsilon versus Eta pattern over the axis for the scale factor for the rates of profits. Somewhere above, a Beta versus Delta pattern arises over the axis for the scale factor.
 |
| Figure 2: Partitions in the Space of Relative Markups |
| Region | Technique | Notes |
| 1 | Beta, Delta, Gamma, Eta | No reswitching, no capital-reversing, no labor-reversing, no process recurrence |
| 2 | Beta, Alpha, Gamma, Delta, Gamma, Eta | Reswitching. Capital and labor-reversing for the switch pt. between Gamma and Delta at the lower wage. Process recurrence in the corn industry. |
| 3 | Beta, Alpha, Gamma, Eta | No reswitching, no capital-reversing, no labor-reversing, no process recurrence |
| 4 | Alpha, Gamma, Delta, Gamma, Eta | Reswitching. Capital and labor-reversing for the switch pt. between Gamma and Delta at the lower wage. Process recurrence in the corn industry. |
| 5 | Alpha, Gamma, Eta | No reswitching, no capital-reversing, no labor-reversing, no process recurrence |
| 6 | Alpha, Epsilon, Eta | No reswitching, no capital-reversing, no labor-reversing, no process recurrence |
| 7 | Beta, Delta, Theta, Eta | No reswitching, no capital-reversing, no labor-reversing, no process recurrence |
| 8 | Beta, Alpha, Gamma, Delta, Theta, Eta | Capital and labor-reversing for the switch pt. between Gamma and Delta. Each process recurs a second time in the corn industry. |
| 9 | Alpha, Gamma, Delta, Theta, Eta | Capital and labor-reversing for the switch pt. between Gamma and Delta. Process recurrence in the corn industry. |
One can use this analysis to consider the effects, on the choice of technique, of perturbations of markups in one industry, given the markups in the other two industries. Figure 1, at the top of this post, plots the maximum wage and the wage at switch points against the relative markup in the steel industry, given that the iron and corn industry are competitive. It corresponds to a horizontal line in Figure 2 at s3/s1 = 1. Around the switch point between the Gamma and Delta techniques in regions 8 and 9, a higher wage is associated with more employment per unit of net output of corn in the economy as a whole. Thus, if the managers in the iron industry are able to impose a greater markup over the going rate of profits or fall below the general competitive level affects the possibilities for labor pressing for greater wages.
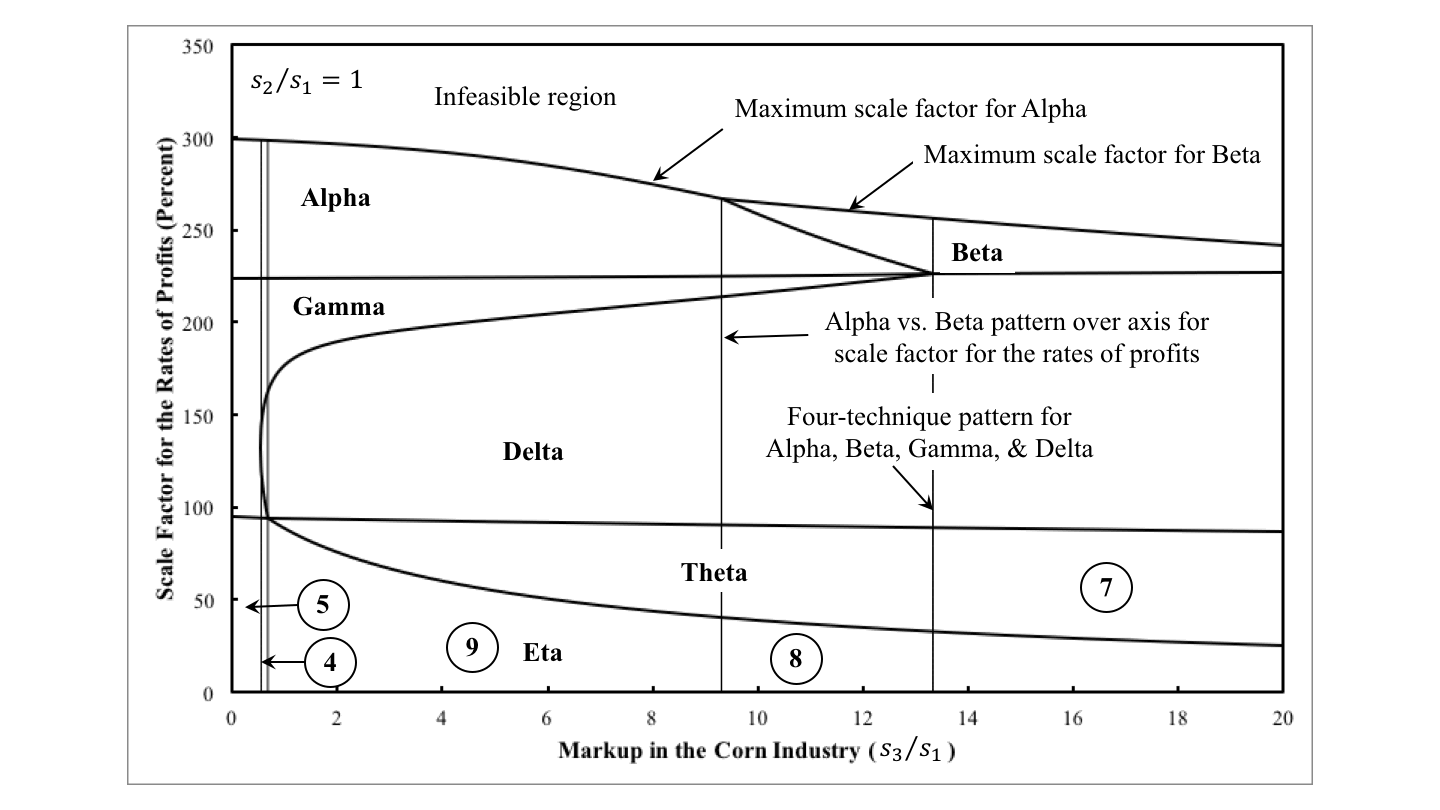
Figures 3 and 4 show the effects of perturbations of markups in the corn industry, given competitive markups in the iron and steel industry. They correspond to a vertical line in Figure 2, extending above the area shown, at s2/s1 = 1. Here, region 4 demonstrates that variations in markups can bring about or remove the reswitching of techniques.
 |
| Figure 3: Variation of Switch Points with the Markup in the Corn Industry (Part 1) |
 |
| Figure 4: Variation of Switch Points with the Markup in the Corn Industry (Part 2) |
One could also consider a ray from the origin in Figure 2 at 45 degrees. This allows one to examine the effects of of perturbations of markups in the iron industry, given competitive markets in the steel and corn industry.
5.0 ConclusionI think this analysis qualifies this idea:
"It is evident that between the two limits of this maximum rate of profit an immense scale of variation is possible. The fixation of its actual degree is only settled by the continuous struggle between capital and labour, the capitalist constantly tending to reduce wages to their physical minimum, and to extend the working day to its physical maximum, while the working man constantly presses in the opposite direction. The question resolves itself into a question of the respective powers of its combatants." -- Karl Marx, 1865. Value, Price and Profit
Details of the class struggle between capital and labor are altered by the results of conflict among capitalists.