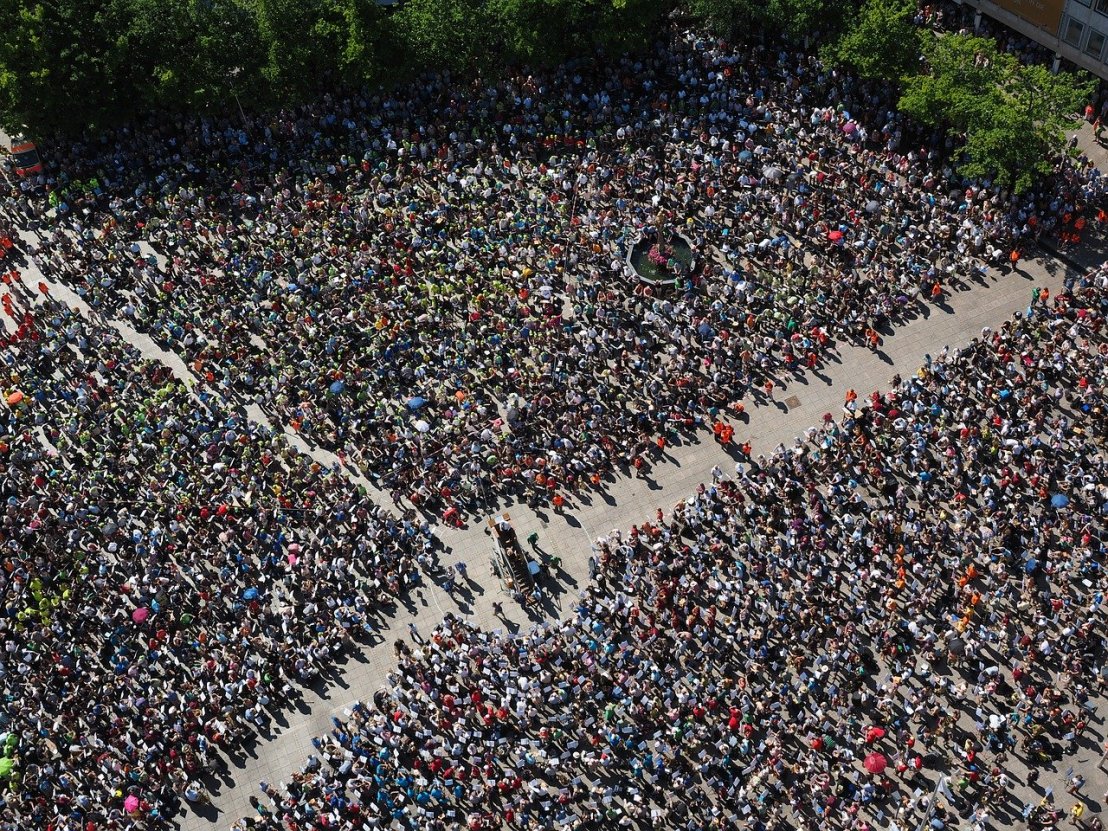
By James Kwak It seems that social distancing is the primary strategy for slowing the propagation rate of COVID-19. That and widespread testing are the key tools for containing an outbreak, for reasons discussed repeatedly in the media. Photo by Hans Braxmeier from PixabayBut does it work? Or, more to the point, how well do different degrees of social distancing work? How strict does it need to be, and how tightly does it need to be enforced? It seems to me that this is an important and at least theoretically answerable question. Thanks to ubiquitous commercial and government surveillance, there are staggeringly comprehensive databases of exactly where people are at all times. Google has one, for example. Picture for yourself an enormous aerial picture of some metropolitan area with a
Topics:
James Kwak considers the following as important: Commentary, COVID-19, statistics
This could be interesting, too:
Nick Falvo writes Homelessness planning during COVID
Stavros Mavroudeas writes COVID-19 Pandemic and Vaccine Imperialism – Review of Radical Political Economics
Angry Bear writes FLiRT Covid wave is growing less rapidly
Bill Haskell writes Some Angry Bear Updates
By James Kwak
It seems that social distancing is the primary strategy for slowing the propagation rate of COVID-19. That and widespread testing are the key tools for containing an outbreak, for reasons discussed repeatedly in the media.

But does it work? Or, more to the point, how well do different degrees of social distancing work? How strict does it need to be, and how tightly does it need to be enforced? It seems to me that this is an important and at least theoretically answerable question.
Thanks to ubiquitous commercial and government surveillance, there are staggeringly comprehensive databases of exactly where people are at all times. Google has one, for example. Picture for yourself an enormous aerial picture of some metropolitan area with a dot for every person’s location; then picture those dots moving around as time passes. That’s more or less what is available. (Some people are blocking their location data, and some people don’t have personal surveillance devices smart phones. But there are certainly enough people transmitting their location to do the analysis discussed below.)
Assume for a moment a can opener that we have a good measure of the number of cases of COVID-19 in any geographic area at any time. (We don’t have to know every case; it would be enough if we were testing a random sample of people every day.) Then the analysis is conceptually simple. We need some measure of social distance. Ideally we’d want to count the number of people that each person comes within one meter of for each day, then average that number across the entire population. GPS is only (theoretically) accurate down to about 5 meters, but it can give us a rough idea of how many people could be close to each other at once. That’s the social distance variable, which we can measure each day. Then we basically need to regress the percentage daily change in the number of COVID-19 cases against the social distance variable, with some sort of lag to account for the fact that cases don’t appear for several days. Given the number of places where there have been outbreaks, we should be able to get some idea of how low the social distance variable has to be in order to flatten out the rate of new infections.
OK, that’s the easy part. Now back to that can opener. The problem is that official case counts depend on three major factors: (a) the underlying rate of infection in the population (what we care about); (b) the number of tests being done; and (c) the selection criteria for those tests. You get very different results if you only test sick people in the hospital as opposed to testing a random sample, even if you do the same number of tests. So the harder question is figuring out how the official case count relates to the underlying rate of infection.
Still, though, this is conceptually just a multivariate regression. On the right (independent variable) side, in addition to the social distance variable, you need a variable for the number of tests, and you need a set of dummy variables for the various testing strategies that different places have employed (i.e., one for the American test-only-the-sick-and-the-rich-and-famous strategy, one for the Korean test-everyone-within-range-of-the-outbreak strategy, and so on). You can probably think of other things you should control for, like the weather (readily available). Again, given the number of outbreaks that have occurred all over the world, there is a decent chance that there is enough variation to actually get results.
There are a couple of problems that the statistically-minded among you have already noticed. One is that once people are trying to implement social distancing, not only will they avoid proximity with other people (which is visible by GPS), but they will also behave differently when they are in proximity with others (not visible by GPS). There are also differences in cultural behavior—handshakes vs. la bise vs. a small bow—that affect propagation. You may be able to overcome that using variation within a single culture (e.g., the United States, where there is plenty of variation in how people in different parts of the country are behaving).
I haven’t the statistical or data management skills to do this myself. And maybe even if it’s done right the margins of error are too big to be useful. But if no one is doing it already, it seems worth trying.
