R.j. sigmund on Covid a few days ago i read an article on a university website that Covid activity was ‘showing signs of slowing’, so that’s what i expected to find when i checked the data this morning…”growing less rapidly” might have been a more descriptive assessment… among the CDC’s “early indicators“, “test positivity”, or the percentage of tests for Covid that were positive, rose to 18.1% during the week ending August 10th, up from 17.6% during the week ending August 3rd, and up from 3.4% eleven weeks ago…that’s a two and a half year high, and the second highest test positivity level since Covid testing began… at the same time, Covid cases accounted for 2.4% of hospital emergency room patients, down from a revised 2.5% of emergency
Topics:
Angry Bear considers the following as important: COVID-19, Healthcare
This could be interesting, too:
Bill Haskell writes Families Struggle Paying for Child Care While Working
Joel Eissenberg writes RFK Jr. blames the victims
Joel Eissenberg writes The branding of Medicaid
Bill Haskell writes Why Healthcare Costs So Much . . .
r.j. sigmund on Covid
a few days ago i read an article on a university website that Covid activity was ‘showing signs of slowing’, so that’s what i expected to find when i checked the data this morning…”growing less rapidly” might have been a more descriptive assessment…
among the CDC’s “early indicators“, “test positivity”, or the percentage of tests for Covid that were positive, rose to 18.1% during the week ending August 10th, up from 17.6% during the week ending August 3rd, and up from 3.4% eleven weeks ago…that’s a two and a half year high, and the second highest test positivity level since Covid testing began… at the same time, Covid cases accounted for 2.4% of hospital emergency room patients, down from a revised 2.5% of emergency patients during the week ending August 3rd, but Covid emergency room visits for that week had first been reported at 2.3% a week ago, so that was revised 0.2% higher….Covid cases had been accounting for just 0.4% of hospital emergency room patients during the disease lull this spring…meanwhile, in data that is two weeks older, the CDC reports that the Covid hospitalization rate rose to 3.3 per 100,000 population during the week ending July 27th, up from an downwardly revised 3.2 per 100,000 the prior week, and up from 1.1 per 100,000 during the week ending May 11th…the Covid hospitalization rate for the week ending July 20th had been reported at 3.3 per 100,000 last week, so that was revised lower..
in a metric that is catching up rather than slowing down, the CDC now reports that Covid accounted for 1.9% of all US deaths during the week ending August 10th, after the 1.5% figure they reported for deaths for the week ending August 3rd was revised up to 1.6%…five weeks earlier, Covid deaths were accounting for 0.8% of all US deaths, so the proportion of Covid deaths has more than doubled over the past month…meanwhile, the CDC’s confirmed Covid deaths graph, which lags current data by 3 weeks, shows there were 566 US deaths from Covid during the week ending July 20th, up from an upwardly revised 476 deaths during the week ending July 13th, and up from an upwardly revised 446 US Covid deaths during the week ending July 6th…that lagging weekly deaths metric is now the highest it’s been since April 6th…
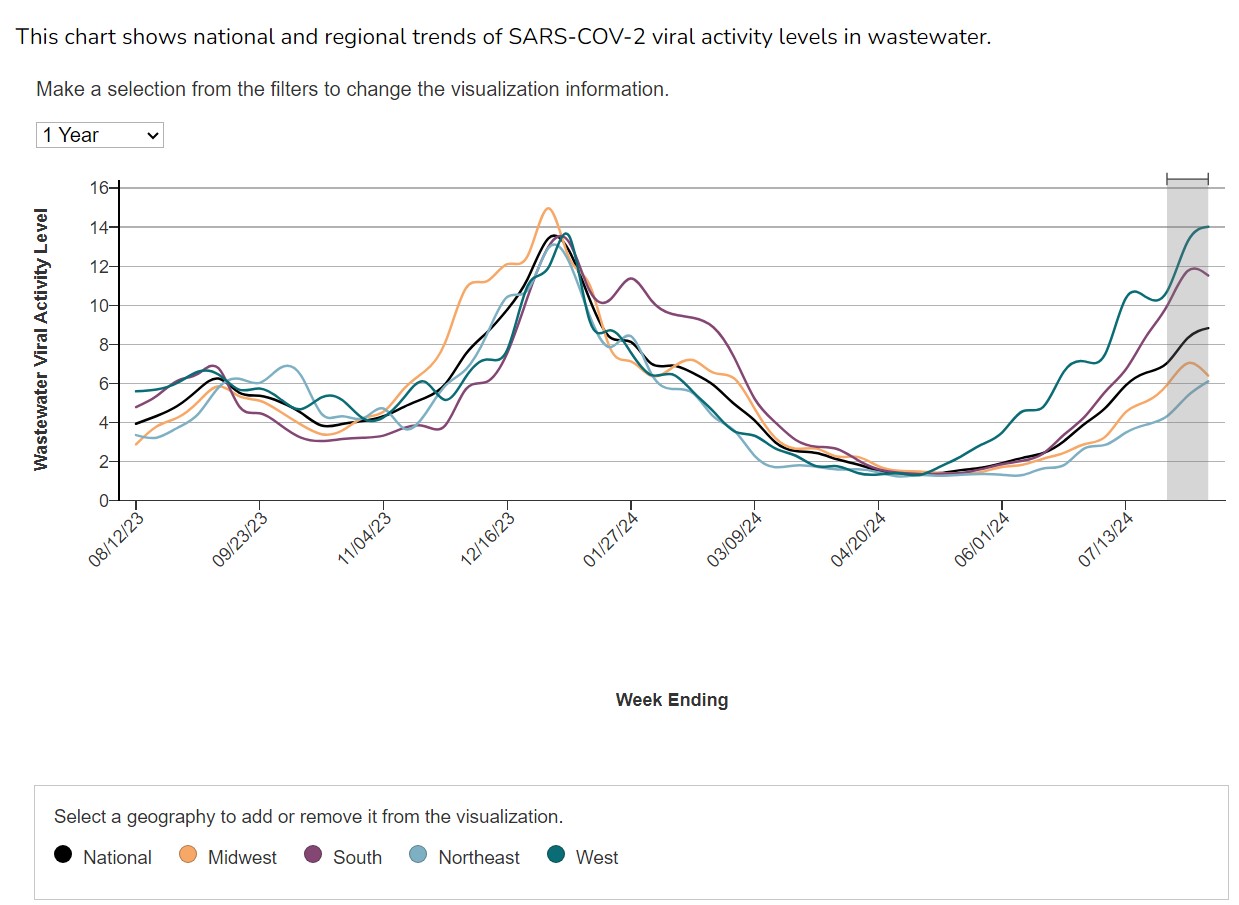
the CDC’s national reading for viral activity in wastewater remains VERY HIGH, but the numerical metric they generate for the viral activity level has turned lower in two regions… their national viral activity graph still shows 15 consecutive increases, with the reading for the week ending August 10th now at 8.80, up from a downwardly revised 8.31 during the week ending August 3rd, and up from 1.36 during the week ending May 4th, which i believe they were calling MINIMAL at the time….the CDC’s viral activity level metric for the West rose from 13.26 for the week ending August 3rd to 14.02 for the week ending August 10th, but their wastewater metric for the South fell from 11.75 for the week ending August 3rd to 11.52 for the week ending August 10th, and their metric for the Midwest fell from 7.02 for the week ending August 3rd to 6.38 for the week ending August 10th, while their metric for the Northeast rose from 5.35 for the week ending August 3rd to 6.10 for the week ending August 10th …again, i don’t know what those numbers mean, but i don’t think that they can be compared to each other, because a years worth of historical data for each region is used in developing those metrics, which gives each region’s metric a different basis…moreover, those metrics are recalculated every six months to include new ‘historical” data…
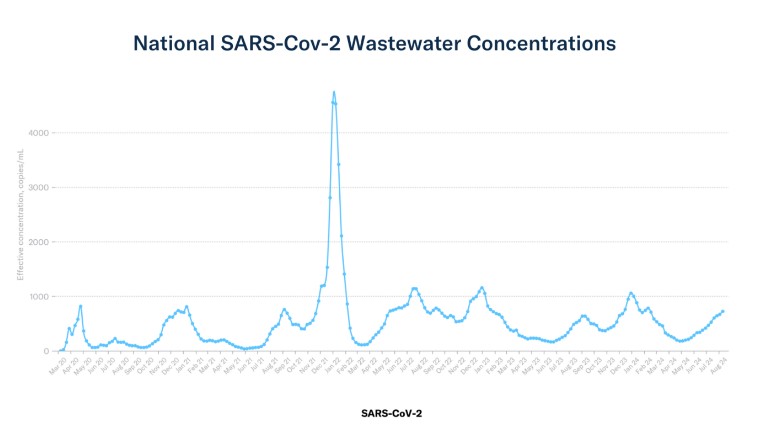
on the other hand, Biobot reports the actual concentration of the Covid virus in US sewer water, so all of their metrics have the same basis…for this week, they reported wastewater concentrations of the Covid virus were rising nationally and in all US regions except the South, where there was a modest downtick…as usual, we’ll just copy and paste the Covid relevant paragraphs from this week’s Biobot report below; as you can see, they show the highest wastewater concentrations of the Covid virus in the Midwest and the Northeast, which are the two lowest according to the CDC’s wastewater metric…if you need to keep score, go with Biobot..
- Biobot’s national wastewater network showed very low national concentrations of influenza A & B and RSV during week 32, while SARS-CoV-2 concentrations continued to increase. We are seeing early warning signs that the RSV season is approaching, with concentrations in the Midwest beginning to increase for the first time in months. Nationally, major clinical metrics remained low for influenza and RSV in week 31, while metrics for COVID-19 remained elevated.
- Wastewater data show that COVID-19 activity and community viral load increased during week 32. The national average SARS-CoV-2 wastewater concentration is now 728 copies per mL.
- SARS-CoV-2 wastewater concentrations held steady in the South during week 32, at 682 copies per mL. Georgia and Tennessee are the two Southern states in COVID-NET. Hospitalization rates remain elevated in both states, increasing in Tennessee in week 31. Rates might be decreasing in Georgia, however, other recent decreases have been corrected to increases, so it is unclear what the actual trend in the state is.
- SARS-CoV-2 wastewater concentrations increased in the Midwest during week 32 at 857 copies per mL. Michigan, Minnesota, and Ohio are Midwestern states in COVID-NET. In week 31, hospitalization rates decreased in all three states.
- SARS-CoV-2 wastewater concentrations increased in the Northeast during week 32 at 808 copies per mL. Connecticut, Maryland, and New York are Northeastern states in COVID-NET. In week 31, hospitalization rates decreased in Maryland and held steady in Connecticut and New York.
- During week 32, SARS-CoV-2 wastewater concentrations increased in the West at 613 copies per mL. California, Colorado, New Mexico, Oregon, and Utah are Western states in COVID-NET. In week 31, hospitalization rates decreased in Colorado, New Mexico, and Oregon, held steady in California, and increased in Utah.
this was the week that the CDC updated it’s variant proportions page, but at first glance there doesn’t seem to be anything new there; those strains that arose and spread rapidly over the past few months have become more dominant, while those variants that were dominant previously, and during this past winter’s surge, have continued to recede….
Omicron KP.3.1.1, which was first listed separately on the CDC’s page a month ago and which became the most common variant circulating two weeks ago, continued to expand its presence, now accounting for 36.8% of the virus samples sequenced during the August 4th to August 17th period, up from 22.4% of the national total during the July 21st to August 3rd period, and up from 12.7% of the total during the period before that…the KP.3.1.1 variant is an offspring of KP.3, and has a change in the spike protein that enhances its transmissibility and immune evasion capabilities, hence it has an effective reproduction number (Rₑ) that’s significantly higher than that of any of the other variants currently circulating…
meanwhile, the KP.3 variant, which is the parent of the KP.3.1.1 strain and is a descendant of JN.1.11.1, continues to be the 2nd most common Covid mutant circulating, accounting for 16.8% of US Covid infections during the two week period ending August 17th, down from a downwardly revised 21.0% share of the total during the July 21st to August 3rd period, and down from 22.7% of the total during the two week period before that…
the KP.2.3 variant, an offspring of the KP.2 variant that the new vaccine is being designed to target, is back to being the 3rd most common mutation circulating, at 14.4% of the virus samples sequenced during the August 4th to August 17th period, down from 16.0% of the national total during the July 21st to August 3rd period, and down from 16.4% of the total during the period before that…i haven’t seen any specifics on the KP.2.3 variant, but since it has largely displaced its KP.2 parent (which now accounts for 3.2% of the national total), if seems likely its mutation also enhances it’s transmissibility and immune evasion capabilities, much as is the case with the mutation of KP.3.1.1…
all three of those most dominant variants, as well as others in the “KP” family of Omicron mutants (which is most of them out there now), have substitutions on virus spike protein that include them in what are called the FLiRT variants (distinguished by a substitution of F for L at position 456 and R for T at position 346 on the spike protein); those substitutions eliminate binding sites for antibodies on that protein that would otherwise neutralize the Covid virus, which explains why they’re running rampant on us now….
meanwhile, the LB.1 variant, a direct descendant of the originally dominant JN.1, is now the 4th most common Covid variant out there, accounting for 14.1% of US Covid infections during the August 4th to August 17th period, down from an upwardly revised 16.6% share of the total during the July 21st to August 3rd period, and also down from 16.1% of the total during the two week period before that…the LB.1 variant is “similar to the FLiRT variants but has an additional mutation (S:S31del)” …
finally, the LP.1 variant, which is an offspring of KP.1.1.3, is still hanging on as the fifth most common variant circulating, accounting for 4.1% of US Covid infections during the two week period ending August 17th, up from a downwardly revised 3.8% share of the total during the July 21st to August 3rd period, and up from 2.6% of the total during the two week period before that…as a descendant of KP.1.1.3, it also has the FLiRT mutations, and apparently more, to distinguish it from it from its parent and grandparent, which are both still circulating as well..
* * * * *