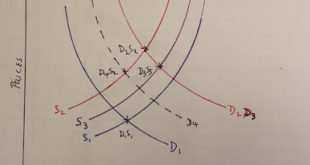
The economic graph of the year for 2023 – by New Deal democrat I’ll put up the final Coronavirus update of the year later today, but before we leave 2023, let me put up the graph that I think explains about 90% of the economic data this past year. And here it is: This was a graph I created, and included in a piece called “Why the Index of Leading Indicators failed” over at Seeking Alpha. Here’s the explanation: the situation just...
Read More »The economic graph of the year for 2023