This should come as no surprise as I have written on the topic of Healthcare Costs and Its Drivers before. In particular, the overriding statistic from an earlier post was 50% of the increase in healthcare costs was due solely to price increases between 1996 and 2013 (JAMA, Factors Associated With . . . . Adjusting for inflation, “annual health care spending on inpatient, ambulatory, retail pharmaceutical, nursing facility, emergency department, and dental care increased from .2 trillion to .1 trillion or 3.5 billion between 1996 and 2013.” This was broken down into 5 fundamental factors contributing to rising healthcare costs. – Increased US population size was associated with a 23.1% increase or 9.5 billion – An aging population was associated
Topics:
run75441 considers the following as important: Health Affairs, Healthcare, Hot Topics, run75441, The Commonwealth Fund
This could be interesting, too:
NewDealdemocrat writes JOLTS revisions from Yesterday’s Report
Joel Eissenberg writes No Invading Allies Act
Bill Haskell writes Families Struggle Paying for Child Care While Working
NewDealdemocrat writes January JOLTS report: monthly increases, but significant downward revisions to 2024
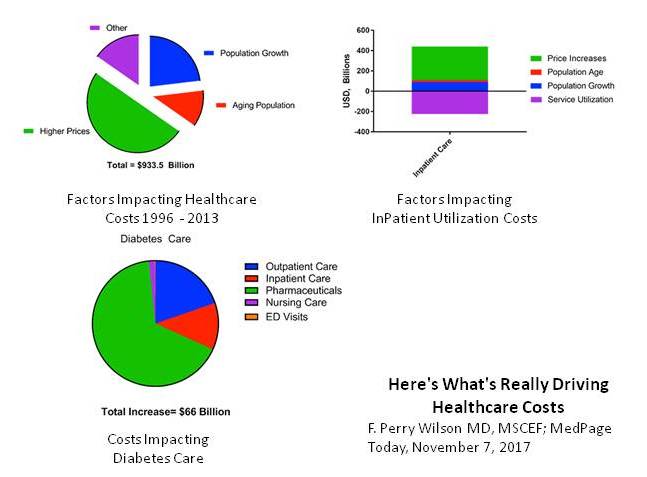
 This should come as no surprise as I have written on the topic of Healthcare Costs and Its Drivers before. In particular, the overriding statistic from an earlier post was 50% of the increase in healthcare costs was due solely to price increases between 1996 and 2013 (JAMA, Factors Associated With . . . . Adjusting for inflation, “annual health care spending on inpatient, ambulatory, retail pharmaceutical, nursing facility, emergency department, and dental care increased from $1.2 trillion to $2.1 trillion or $933.5 billion between 1996 and 2013.” This was broken down into 5 fundamental factors contributing to rising healthcare costs.
– Increased US population size was associated with a 23.1% increase or $269.5 billion
– An aging population was associated with an 11.6% increase or $135.7 billion
– Changes in disease prevalence or incidence (inpatient, outpatient, ED) resulted in spending reductions of 2.4% or $28.2 billion
– Changes in service utilization (inpatient, dental) were not associated with a statistically significant change in spending
– Changes in service price and intensity were associated with a 50.0% increase or $583.5 billion.
Five fundamental factors (Population size, Population aging, Disease prevalence or incidence, Service Utilization, and Service Pricing) were collectively associated with a $933.5 billion increase in annual US health care spending between 1996 through 2013. Represented pictorially, stated objectively, and categorized numerically, I can not make it any more obvious.
Some Explanation
The change in disease prevalence or incidence was associated with a spending reduction of 2.4%, or $28.2 billion while the change in service utilization did not result in a statistically significant change in spending. Said another way, these two factors had little or no impact on the rising cost of healthcare.
The increased healthcare costs from 1996 to 2013 were largely related to Healthcare Service Price and Intensity and secondarily impacted by Population Growth and Population Aging in order of impact. The bar chart reflects all of the impact in changes.
So the aging tsunami of baby boomers has not hit yet and population growth has not greatly impacted the results of this study. In patient stays at hospitals are down as well as out patient use of facilities. The big issue is the change in pricing for inpatient hospital stays and pharmaceuticals. Hospital/clinic consolidations leads to the former even though insurance has been fighting for a reduction in stays. Pharmaceutical has instituted new pricing strategies which we have all read about in the news. Old drugs such as Humalog, Viovo, and the infamous Epipens as well as others are now more expensive. This study points to pricing for pharma and service as the issues.
An example?
There is a tendency to challenge the lifestyle practices of people who indulge in too much. One factor did come out in the increased cost of healthcare. The increase in annual diabetes spending between 1996 and 2013 was $64.4 billion of which $44.4 billion of this increase was pharmaceutical spending. Said another way, two-thirds of the increase in treating diabetes was due simply to the increased pricing of pharmaceutical companies.
And yes, there should be time spent on changing habits where it can be changed and providing the means to do so. However, in 1996 Eli Lilly’s Humalog was $21 per vial. By 2017, the price increased to $275 (700%) for a vial which equates to a one-month supply.
Why has the cost of Humalog increased? “The truth is the improvements in new formularies of old versions which are marginally different, and the clinical benefits of them over the older drugs have been zero.” Just like slapping “new and improved” on the labels of food products with a change of ingredients (which qualifies under USDA and FDA labeling regs)., pharmaceuticals can play the same game and they do.
As the article (“Eli Lilly Raised U.S. Prices Of Diabetes Drug 700 Percent Over 20 Years”) explains, “most patients do not pay the full cost/price of a drug up front and absorb their portion of the cost via an increase in monthly healthcare premiums.” This leads to pharmaceutical companies charging as much as the U.S. insurance companies will let them. Both parties profiting from increased prices. Perhaps Alex Azar the Secretary of Healthcare can explain it better as he was an officer of Eli Lilly when Humalog began its ascend?
Another Study via Health Affairs
A shorter time period extending one year longer than the Jama study, the Health Affairs study supports what is being said in the JAMA study. According to data from the Henry J. Kaiser Family Foundation, total health spending on the privately insured in the United States increased in real terms by nearly 20 percent from 2007 to 2014.
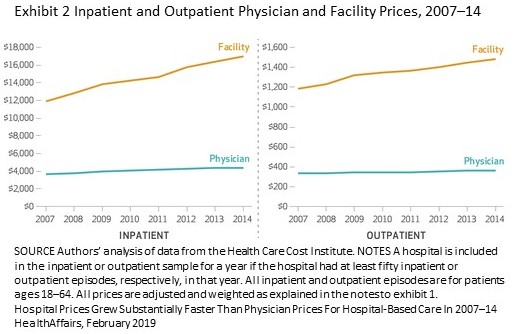
 A more recent study funded by the Commonwealth Fund and published by Health Affairs examined other costs impacting healthcare. Commonwealth Fund supported researchers recently analyzed hospital and physician prices for inpatient and hospital-based outpatient services as well as for four high-volume services: cesarean section, vaginal delivery, hospital-based outpatient colonoscopy, and knee replacement. Its findings were as follows:
– From 2007 to 2014, hospital-prices for inpatient care grew 42 percent compared to 18 percent for physician-prices for inpatient hospital care
– For hospital-based outpatient care, hospital-prices rose 25 percent compared to 6 percent for physician-prices
– There was no difference in results between hospitals directly employing physicians and indirectly employing physicians
– Hospital prices accounted for over 60 percent of the total price of hospital-based care.
– Hospital prices accounted for most of the cost of the four high-volume services included in the study. The hospital component ranged from 61 percent for vaginal deliveries to 84 percent for knee replacements.
Sound familiar? The JAMA study looked at both in and out patient costs/prices associated with hospital services and said they were up. The Health Affairs study looks at in patient services for four high volume inpatient services stating they have increased significantly from 2007 to 2014.
What the Health Affairs study Showed
The Health Affairs study also presents a comparison of hospital pricing growth rates as compared to physician pricing growth rates. The study is only a few weeks old and I am surprised I am able to access as much information as I have. While Health Affairs admits the study is a start and more work differentiating other aspects must be done, the study suggests there are significant growth in the bargaining leverage of hospitals as compared to physicians.
If you recall Rusty “Tom” and I engaged in a number of different conversations on healthcare with one of them being hospital consolidations (2013). It is a power grab, as Rusty pointed out, for more market segment and pricing control with those having name-recognition gaining the most. Maggie Mahar also referenced the same issue.
In my own commentary On the Horizon After Obamacare (2014): As it stands and even with its faults, the ACA is a viable solution to many of the issues faced by the uninsured and under-insured; but in itself, it only addresses the delivery-half of the healthcare problem. The other half of the problem rests with the industry delivering the healthcare and the control of pricing through the inherent monopolistic power coming and pushing the industry into greater integration of delivery. As Longman and Hewitt posit,
“the message from Department of Health and Human Services stresses the vast savings possible through a less ‘fragmented and integrated’ health care delivery system. With this vision in mind, HHS officials have been encouraging health care providers to merge into so-called accountable care organizations, or ACOs”; “while on the other side of the Mall, ‘pronouncements from the FTC are about the need to counter the record numbers of hospitals and doctors’ practices merging and using their resulting monopoly power to drive up prices.”
Two different messages from government, greater efficiencies in healthcare through consolidations as ACOs versus monopolistic pricing control in healthcare by large hospital and pharmaceutical corporations an unintended result. There is large amounts of inefficiencies, waste, and rent-taking in healthcare as well as in Medicare which is touted as the go-to by politicians and advocates of it. Lets not make a similar mistake, the creation of any forthcoming healthcare system must first address the costs of healthcare and then the delivery of it not ignoring the quality of the product and its outcome after treatment. Again Maggie Mahar was big on promoting this result emanating from any new system.
While Physician fees grew at a compounded annual rate of 6% for baby deliveries and 1% for office visits between 2003 and 2010, hospitals fees during a similar period grew at 17%.
A measurement of the competitiveness of a hospital within a certain area of the country is done utilizing the Herfindahl-Hirschman Index (HHI). It has been used to measure competition in and around cities. The results of the HHI revealed an increase in the concentration of hospitals from mergers and acquisitions, going from moderately concentrated in 1990 with an HHI numeric of 1570, to more concentrated in 2009 with a HHI of 2500, and with some cities purely monopolistic at 10,000.
Rigorous action by the FTC would certainly go a long way in improving compositeness; however, the FTC has been purposely understaffed by cutting its funding. In place at the FTC is a staff 22 lawyers and economists to monitor a $3 trillion healthcare industry. It is too understaffed to take on such a large industry which would overwhelm it with legalese and paper. Maybe in the next election will bring forth the right person to take on healthcare.
Resources
Hospital Prices Grew Substantially Faster Than Physician Prices For Hospital-Based Care In 2007–14, Zack Cooper, Stuart Craig, Martin Gaynor, Nir J. Harish, Harlan M. Krumholz, and John Van Reenen, HealthAffairs, February 2019
Zack Cooper Hospital Care Prices Rose Faster Than the Cost of Physician Services, February, 2019
After Obamacare Phillip Longman and Paul S. Hewitt, Washington Monthly, January – February 2014
