100 years of industrial production This is a post that can literally be written only once in 100 years! Because as of last Friday, it has been exactly 100 years since the first publication of industrial production by the Fed in January 1919. So this is a good time to take a sweeping historical look at production in the United States. The first graph below is the entire 100 year history, on log scale so that equal percentage changes in each time period are calibrated equally: A few features stand out: the Great Depression, the World War 2 boom, and two downshifts in the long term trend: first in the 1970s-1999, and second from 1999 to the present. In fact, the past 20 years have been the slowest secular period since publication of industrial production
Topics:
NewDealdemocrat considers the following as important: Taxes/regulation, US/Global Economics
This could be interesting, too:
Joel Eissenberg writes How Tesla makes money
Angry Bear writes True pricing: effects on competition
Angry Bear writes The paradox of economic competition
Angry Bear writes USMAC Exempts Certain Items Coming out of Mexico and Canada
100 years of industrial production
This is a post that can literally be written only once in 100 years!
Because as of last Friday, it has been exactly 100 years since the first publication of industrial production by the Fed in January 1919. So this is a good time to take a sweeping historical look at production in the United States.
The first graph below is the entire 100 year history, on log scale so that equal percentage changes in each time period are calibrated equally: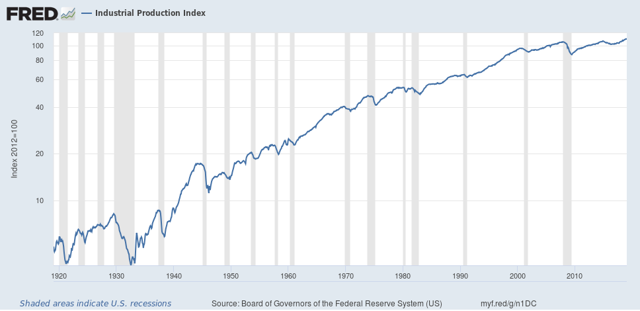
A few features stand out: the Great Depression, the World War 2 boom, and two downshifts in the long term trend: first in the 1970s-1999, and second from 1999 to the present.
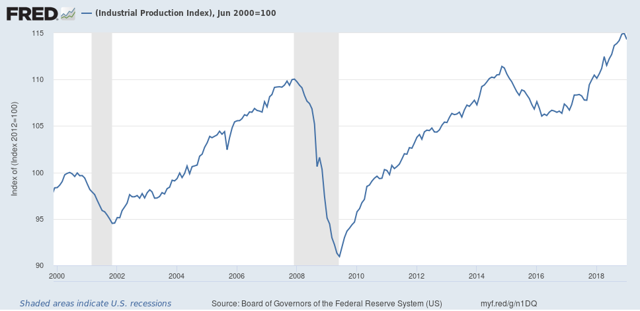
In fact, the past 20 years have been the slowest secular period since publication of industrial production started 100 years ago. As shown in the below graph, normed to 100 in June 1999, production has only grown 15% in the 20 years since. It grew just under 10% during the 2000s expansion, and only about 5% in the last 11 years:
The worst previous period was the 1929-37 portion of the Great Depression, but even there production grew 6% by the end of that 8 year period, and exceed a 15% gain from 1929 by late 1940, 11 years later: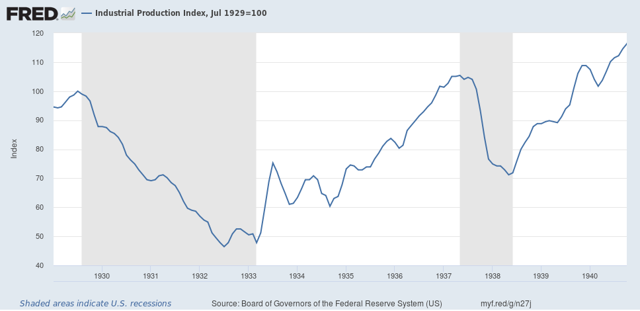
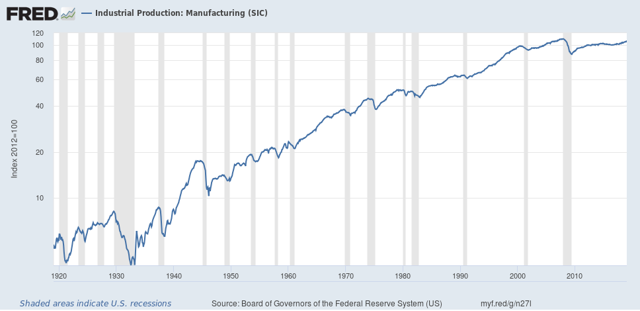
Note that growth has for all intents and purposes stopped since 1999.Again focusing just on the last 20 years, we see that manufacturing production grew just 11% during the 2000s expansion, and even now 11 years later, has still not equaled the 2007 peak: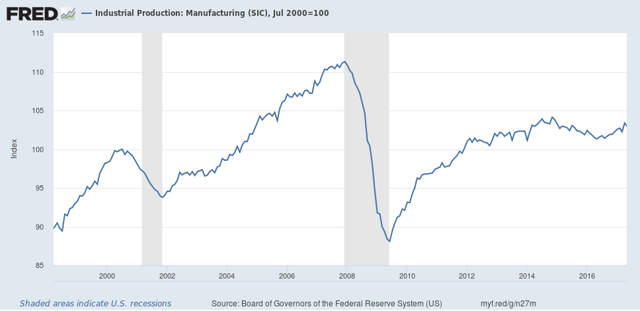
Total growth over the last 20 years in manufacturing has been just 3.4%.
Taking the long historical view shows the relative — and in the last decade, absolute — decline of the US as a manufacturing power. And it also puts paid to the notion that, at least in the last 20 years, the decline in manufacturing employment is mainly about productivity and mechanization. If it woeren’t for the rebirth of “Saudi America” in the energy sector over the last 10 years, industrial production growth in the US would have completely stopped.