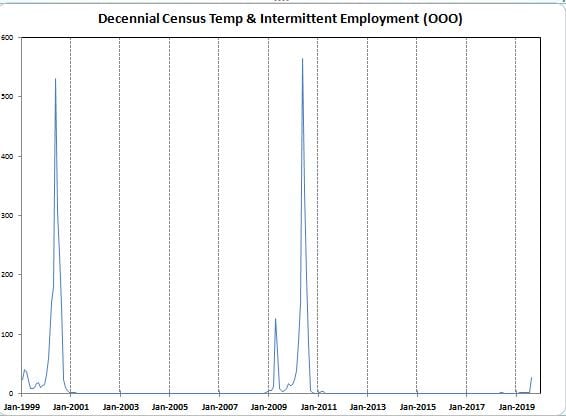
There seems to be some confusion about the impact of Census employment of temporary and intermittent employment for the 2020 Census. The U.S. Bureau of Labor Statistics has a table showing the monthly employment for Special Census workers. You can find it at: BLS – Special Census Workers The table also has the data from the 1990 and 2000 Census so you can compare what happened in those Censuses to what to expect over the next year. I took the data from Table 1 of total nonfarm employment and subtract the Census employment to create a new series, Total NonFarm Employment excluding Census Temp & Intermittent Employment. The chart shows the last some 20 years of special Census employment. As you can see, this months 27,000 increase hardly shows in the
Topics:
Spencer England considers the following as important: politics, US/Global Economics
This could be interesting, too:
Robert Skidelsky writes Lord Skidelsky to ask His Majesty’s Government what is their policy with regard to the Ukraine war following the new policy of the government of the United States of America.
Joel Eissenberg writes No Invading Allies Act
Ken Melvin writes A Developed Taste
Bill Haskell writes The North American Automobile Industry Waits for Trump and the Gov. to Act
There seems to be some confusion about the impact of Census employment of temporary and intermittent employment for the 2020 Census.
The U.S. Bureau of Labor Statistics has a table showing the monthly employment for Special Census workers. You can find it at: BLS – Special Census Workers
The table also has the data from the 1990 and 2000 Census so you can compare what happened in those Censuses to what to expect over the next year. I took the data from Table 1 of total nonfarm employment and subtract the Census employment to create a new series, Total NonFarm Employment excluding Census Temp & Intermittent Employment. The chart shows the last some 20 years of special Census employment. As you can see, this months 27,000 increase hardly shows in the chart compared to what happened in the 2000 and 2010 Censuses or what we can expect over the next year.