In economics we have the concept of “revealed preference” that simply states that you do not pay attention to what an individual claims to prefer. Rather, you pay attention to what they actually do.
President Trump just elected to go to Walter Reed National Military Medical Center for treatment of his COVID-19 symptoms. He could have elected to go to any hospital in the country, but he choose to go to the most purely socialist medical center in the country, one owned by the government and all it’s employees are government employees. Just as the military is the purest example of socialism in the US, Walter Reed is the purest example of socialized medicine in the US.
So Trump’s revealed preference is that he prefers socialized medicine to private medical
Articles by Spencer England
Fed Deficit Leaps From Under 5% of GDP last year to 15% Now
August 11, 2020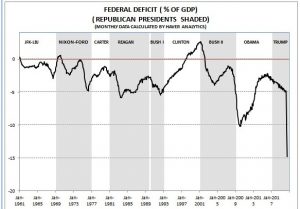
In the second quarter, the federal deficit leaped from under 5% of GDP last year to near 15% now. This is new record compared to the prior record of almost 10% of GDP that Obama inherited from Bush
Yes, falling nominal GDP played a role, but a weak economy always plays a role in setting new record deficits. But in considering what new stimulus Washington comes up with it will serve us well to remember that the new base line already starts at 15% of GDP.
While economists and others are debating the shape of any economic rebound we may happen to experience, it might serve you well to remember Japan’s lost decade. It was dominated by the government repeatedly providing stimulus with one hand while simultaneously taking it away with the other hand All the
Protected: Fed Deficit as a % of GDP now at new record
July 10, 2020This content is password protected. To view it please enter your password below:
Password:
S&P PE NOW BACK ABOVE FAIR VALUE
June 17, 2020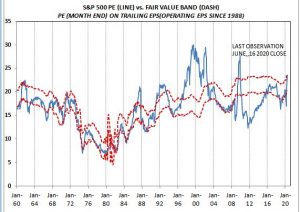
After the recent market rebound the S&P 500 valuation has risen from below my estimated fair value to just over the top of the fair value band.
It is important to remember that much of the rebound in the S&P PE is due to weaker earnings. In the second quarter earnings are falling at double digit rates. But if second quarter real GDP is falling at a 40% to 50% rate earnings estimated are still too high.
Wall Street says do, not fight the Fed. One measure of Fed policy is money supply growth and as the chart shows MZM ( zero maturity growth) is surging to near record highs. This implies that the market PE is going to continue to rise and it should pull the overall market with it despite the fact that earnings estimates are probably too high.
The 2.5 million employment gain in perspective
June 6, 2020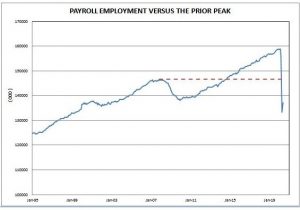
The 2.5 million employment gain does not look too impressive from this perspective.
Read More »BOND YIELDS AND MONETARY VELOCITY
May 28, 2020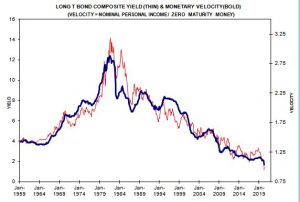
I have been monitoring the close relationship between bond yields and monetary velocity ( personal income/zero maturity money) for years without coming to strong conclusion about what to make of it. In particular, it displays the long term secular rise and fall of bond yields before and after 1980..
I do not know of any other economic variable that parallels bond yields so tightly for such a long period. OK, first question. Which way does the causal relationship work? Is it rates driving velocity or velocity driving yields? Or is it some other variable driving both? I use to think velocity was a function of real interest rates. At least that was consistent with the monetarist school of economic thought, especially in explaining the 1930s
Read More »Fauci: No scientific evidence the coronavirus was made in a Chinese lab
May 10, 2020National Geographic published this. This seems to be an unusual topic for that publication and I wonder why Fauci selected it.
Fauci: No scientific evidence the coronavirus was made in a Chinese lab
The rest is copied exactly from National Geographic
Fauci, the director of the U.S. National Institute of Allergy and Infectious Diseases, shot down the discussion that has been raging among politicians and pundits, calling it “a circular argument” in a conversation Monday with National Geographic.
“If you look at the evolution of the virus in bats and what’s out there now, [the scientific evidence] is very, very strongly leaning toward this could not have been artificially or deliberately manipulated … Everything about the stepwise evolution over time
Daily Cases: Coronavirus:New York vs. Rest of US
May 7, 2020
It looks like many states are preparing to end stay at home quarantine.
If you look at the numerous charts around on the number of new coronavirus-19 cases reported each day it looks encouraging. They show a peaking and a very slow decline or at best a plateau.
However, this plateau is the product of two very different curves for New York city and the rest of the country. It is New York city falling and the rest of the country rising significantly.
Don’t Be Fooled by America’s Flattening Curve
Don’t Be Fooled by America’s Flattening Curve, NYT, Nathaniel Lash, May 6, 2020
This looks very much like the various state governments could be lifting the quarantine just as they experience a surge in new cases.
For example, in Texas the 7 day moving average of
OIL PRICES
April 20, 2020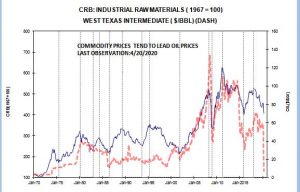
Oil prices are collapsing as West Texas intermediate is now trading at just over $11/bbl
Oil prices move to the point where the marginal supply is profitable or unprofitable. In today’s world the marginal oil supply is US fracked oil. But the economics of fracked oil differs from traditional oil in that the current cost of production is very high as compared to most traditional sources where current costs are relative insignificant and the bulk of the cost is sunk or fixed costs. Even if the prices make production unprofitable, it still minimizes losses to continue producing as long as you are covering your variable costs. That use to describe most US oil production. But now the variable cost of fracked oil is very high and the oil companies will not
S&P 500 PE
March 11, 2020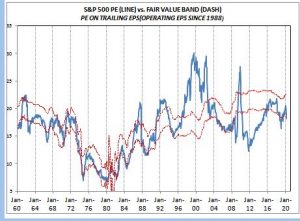
As of the market close on 11 March 2020 the S&P 500 PE had fallen to 18.2. This makes the market cheap in my valuation model as it has fallen below my fair value band.
Moreover, with interest rates still falling to new record lows the fair value band is also rising. In the chart the fair value band is based on February data while the last PE observation is based on the 11 March 2020 close. But with yields approaching the zero lower band it becomes questionable whether or not even lower rates can generate a significant rebound in the market PE and the market. On the other hand the PE has room to move significantly higher just by rebounding to the top, or above, the existing fair value band.
On Wall Street the consensus still is forecasting a significant
Personal report from Italy
March 9, 2020My brother lives in Lucca, Italy ( near Florence) and sent the following report.
We’re not quite at the “Bring Our Your Dead” stage. Schools & museums are closed, flights are being canceled, but all in all life in Lucca is quiet & normal. Many shops are closed for their usual breaks this time of year. There are virtually no tourists, but this is the slow season. Nancy just spent the weekend in Florence and found it to be delightfully empty.
Tuscany is not in the area where travel is being restricted—as yet. Bars and restaurants are open for the most part, but are told to keep one meter of space between customers.
The authorities are being quite active to do what they can. One reason that Italy has reported so many cases is they they have tested so many
Read More »The Stock Market in Presidential Terms
March 3, 2020Before the recent swoon stock market market performance under Trump had been quite favorable. The market gain since his inauguration (100) had been (144) similar to those under Clinton (141) and Obama (150). At this point Ike actually had the best return ( 170) but Ike and Truman are not included in the chart because it is too cluttered already.
After the recent market drop he is now more or less in the middle of the pact for recent presidents — even with JFK-LBJ and behind most democrats and ahead of most republicans.
But if he wants a strong market-economy going into the election it is easy to see why he strongly favors the 50 basis point cut by the Fed. The market doesn’t seem quite sure what to make of the Fed’s actions, first rallying strongly and
Long Bond Yields vs The Long Wave
January 6, 2020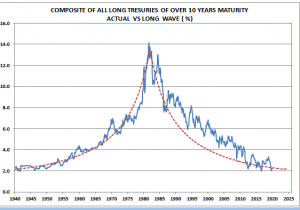
Different bloggers have been posting their favorite charts of 2019 this January. So I decided to post my favorite chart of the past 20, or more, “years of the long bond yield versus the long run trend.” Bond yields are now below their long run trend and may be at or near a secular bottom. Of course no one rings a bell at the turning point so we probably will only identify the bottom long after it actually occurs.
Read More »REAL TRADE BALANCE
December 16, 2019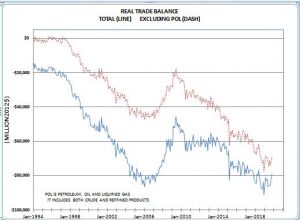
In October the real trade deficit fell to $79,133 (million 2012 $) from the third quarter average of $84,713 (million 2012 $), a 6.6% improvement. This implies that the fourth quarter is starting with trade making a significant large boost to fourth quarter real GDP growth. Remember, the trade balance is the difference between two very large numbers so a small change in either exports or imports can generate a large change in the balance. The year over year percent change in exports is down -0.6% and imports have fallen -4.1%. But since the December, 2018 peak, the real trade balance has contracted -13.2%.
When you look at the details of US real trade, the changes in trade stem largely from oil and consumer goods. Other trade categories, like food,
Chairman Paul Volcker Died at age 92
December 9, 2019I first met Volcker when I was a junior international economist in Washington in the late 1960s. He was the Treasury Under Secretary for International Economics. I was going to a luncheon at the National Press Club for the Indian Finance Minister. As I got on the elevator, Paul Volcker and John Kenneth Galbraith — among other things he was the US Ambassador to India under Kennedy –followed me on. I am 6’2″ — or at least I was back then — but they were both well over 6’6″. I honestly believe that was the only time in my life that I was the shortest economist in the room.
This was back when they had the annual International Monetary Fund( IMF) meeting in Nairobi, Kenya. The standing joke was that they had the meeting in Nairobi so everyone could compare
S&P 500 BY PRESIDENTIAL TERMS
November 8, 2019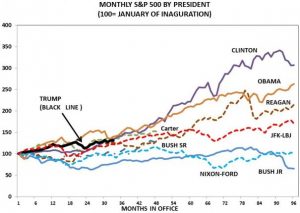
With the presidential election still a year away, Wall Street is starting its normal analysis that if a democrat is elected it will cause a devastating stock market crash. One would think that after all these years of such claims being proven dead wrong that the street would finally give up on it. In the post WWII era from Truman to Obama it is 70 years and each party has had bad candidates in office for half that time. Truman was only President for seven years and five months so the Democrats only had 35.4 years in office while the Republicans had 36 years in office. Over these years the average annual S&P 500 gains was 15.9% for Democrats and 6.6% for Republicans. If you look at the actual returns, you would think if anything; Wall Street analyst
Read More »STOCK MARKET DOWNSIDE RISK VS. UPSIDE POTENTIAL
October 3, 2019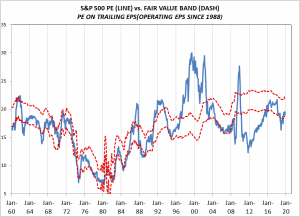
Despite all the recent stock market volatility the actual S&P 500 PE on trailing operating earnings is almost exactly where my model says it should be.
The biggest problem is that the market PE is about 19 and bond yields are under 2%. The quick and dirty rule of thumb is that a 100 basis point change in yields should generate a 100 basis point change in the S&P 500 PE. With bond yields already under 2% the upside potential for the market PE is under 200 basis points — driving the PE to the upper limit of the fair value band.
Consequently, further market increases are almost completely dependent on earnings growth. But currently, unit labor cost are rising faster than prices as measured by the non-farm business deflator and world economic growth
Economic and Market Risk
September 16, 2019The use of drones against Saudi Arabian oil facilities changes the economic-market risk significantly.
Until now the oil producers have done an excellent job of preventing terrorist attacks from disrupting oil supplies. But the use of drones significantly changes the risk of future oil disruptions. How do we prevent future drone attacks on the choke points in the oil supply line?
I, for one, am surprised that the stock market reaction has been so muted.
Am I wrong in believing that the game has changed?
Tariffs and Price Changes
September 11, 2019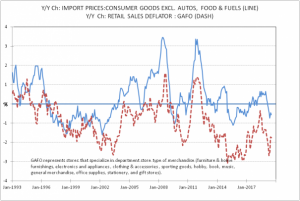
I have been looking at the data recently to find economic series that would quickly reflect the impact of rising tariffs on the consumer.
One is Retail Sales: GAFO. Think of it as department store type merchandise — goods excluding autos, food and energy. It is reported every month in both the Census retail sales press release and in the BEA measures of retail sales they compile in putting together personal spending and GDP. I have long preferred the BEA data because it provides very detailed measures of retail sales and real growth. Moreover, the practice of some to deflate the Census retail sales data with the CPI overstates retail price increases and under states real sales growth.As the chart shows price changes in GAFO sales moves very closely with
Decennial Census Temp & Intermittent Employment
September 9, 2019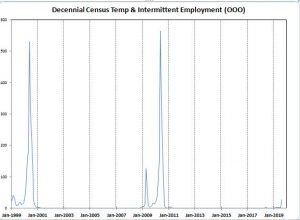
There seems to be some confusion about the impact of Census employment of temporary and intermittent employment for the 2020 Census.
The U.S. Bureau of Labor Statistics has a table showing the monthly employment for Special Census workers. You can find it at: BLS – Special Census Workers
The table also has the data from the 1990 and 2000 Census so you can compare what happened in those Censuses to what to expect over the next year. I took the data from Table 1 of total nonfarm employment and subtract the Census employment to create a new series, Total NonFarm Employment excluding Census Temp & Intermittent Employment. The chart shows the last some 20 years of special Census employment. As you can see, this months 27,000 increase hardly shows in the
IS TREND PAYROLL EMPLOYMENT REALLY WEAK?
September 7, 2019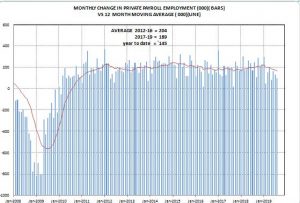
For seven years from 2012 to 2018 the monthly payroll employment showed a solid trend of around 200,000 gains each and every month. If it was much above or below this trend, analysts found some excuse to explain the difference and expected the off-trend observation to be quickly reversed. So far this year most analysts continued to act as if this pattern was being repeated.
However, in August the Bureau of labor Statistics (BLS) rebenchmarked the data to more recent Census data. They announced that it would lower reported employment growth but they did not release the revised data until the August employment report last Friday. The new data shows that 2019 payroll employment was significantly weaker than originally reported. The January monthly increase
Why is current economic growth called strong?
September 3, 2019As of the second quarter the year over year percent change in real GDP is 2.3%. Virtually everyone refers to this as strong. Why? By historic standards 2.3% real GDP growth is subpar. It is below the long term growth rate of the economy using virtually any widely accepted estimate of trend or potential growth. Many republicans actually claim that the potential growth rate is now 4%. If so, it would only make Trump’s 2%-3% growth look worse.
In 1967, real GDP growth was 2.7%, significantly stronger than the current rate. Yet, that was labeled as a GROWTH RECESSION. In Obama’s second term, after the recession and economic recovery, his economic expansion averaged 2.4% growth, or essentially the same growth Trump has experienced during what is actually
Importance of Imports
August 21, 2019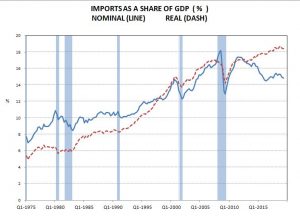
It is standard analysis to see real and nominal imports as a share of GDP quoted to estimate the importance of imports in the economy. Currently that shows nominal imports are about 15% of GDP and real imports are some 18% of real GDP.
But I suspect that this comparison understates the role of imports in the economy because services are some 45% of GDP but only about 16% of imports. As my high school algebra teacher was fond of saying, you are adding crabs and apples. Rather, you should compare real goods imports to real goods GDP. On this basis imports are some 46% of GDP, a much larger share than standard analysis shows. (second chart fixed….Dan)
This impacts the economy through two routes. One, import prices are frequently the marginal price that
Read More »Quality Spreads
August 15, 2019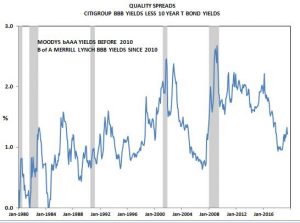
While the yield curve turning negative is getting a lot of attention and seems to be the main excuse for yesterdays stock market drop, there are other financial indicators that are also signaling weaker economic growth ahead.
The primary one is quality spreads as the yield on corporate bonds are rising relative to treasuries. This is driven by investors fear that in a weak economy, recession environment the risk of corporate defaults rises and bond buyers demand a larger premium to take that larger risk.It is easy to see that quality spreads are driven largely by economic weakness by comparing them to capacity utilization.
Long Treasuries vs The Long Wave
August 8, 2019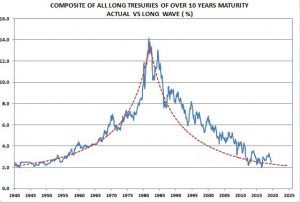
Since the early 1990s, I published this chart every month on the back cover of my publication until I retired a couple of years ago. I thought it was a great piece of marketing to remind readers that I was a long run bull on interest rates.
Readers might not pay much attention or remember claims that I was bullish, but they would pay attention to and remember this. I even had bond managers walk out over this chart in the middle of my presentation.
Now just felt like a good time to publish it again.
Click on image to enlarge it for better viewing.
Read More »Trump vs China
August 7, 2019Trump should not forget that the Chinese leadership does not have to hold an election in 2020.
I wonder who this gives an advantage in the trade war.
Economy may be weaker than generally recognized
August 6, 2019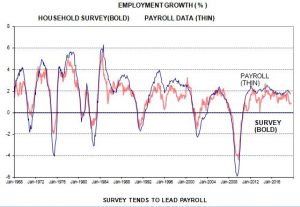
Note how the survey data is weakening more than the payroll data
The survey data tends to lead the payroll:
In 2019 payroll employment — what Wall Street pays attention to –is the weakest since 2012.
Moreover, hours worked has flattened out:
Finally, average hourly wage growth is also weak.
Read More »The Federal Deficit by Presidential Terms
July 27, 2019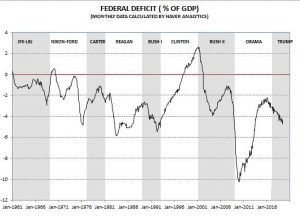
Under Trump the federal deficit has rebounded to some 4.4 % of GDP — it is the same whether you look at it quarterly or monthly data as this chart does. The monthly estimate is calculated by Haver Analytics. So much for the tax cut paying for itself.
The shaded areas are by Presidential term, not of recessions as is usually the case. Typically, Republicans leave office with a larger deficit than they inherited while Democrats leave with a smaller one, or a surplus. Of course, this is exactly what “starve the beast” calls for.
Read More »THE EPIC JOURNEY OF APOLLO ELEVEN
July 19, 2019
This is my oldest son the weekend of the Apollo moon landing.
The whole country was glued to their TVs that week.
Figure 1
The TV was about the state of the art 50 years ago and my brother, the photo journalist, took the photo. In the pre-digital era he mostly worked in black and white.