Coronavirus dashboard for November 3 Total US confirmed infections: 13,383,320* Average US infections last 7 days: 162,365 (vs. latest low of 34,354 on Sept 12) Total US deaths: 266,873 Average US deaths last 7 days: 1,430 (vs. latest low of 701 on Oct 16) *I suspect the real number is 18-19,000,000, or between 5 to 6% of the total US population Source: COVID Tracking Project Infections are out of control over much, if not most, of the country. North and South Dakota, the 2 worst States, now have had confirmed infections in over 10% and over 9% of their entire populations (and probably much worse than that since many asymptomatic cases go undetected): While the earliest hard hit States, NY and NJ, still have had the highest death tolls, 8 more States
Topics:
NewDealdemocrat considers the following as important: Healthcare
This could be interesting, too:
Bill Haskell writes Families Struggle Paying for Child Care While Working
Joel Eissenberg writes RFK Jr. blames the victims
Joel Eissenberg writes The branding of Medicaid
Bill Haskell writes Why Healthcare Costs So Much . . .
Coronavirus dashboard for November 3
Total US confirmed infections: 13,383,320*
Average US infections last 7 days: 162,365 (vs. latest low of 34,354 on Sept 12)
Total US deaths: 266,873
Average US deaths last 7 days: 1,430 (vs. latest low of 701 on Oct 16)
*I suspect the real number is 18-19,000,000, or between 5 to 6% of the total US population
Source: COVID Tracking Project
Infections are out of control over much, if not most, of the country. North and South Dakota, the 2 worst States, now have had confirmed infections in over 10% and over 9% of their entire populations (and probably much worse than that since many asymptomatic cases go undetected):
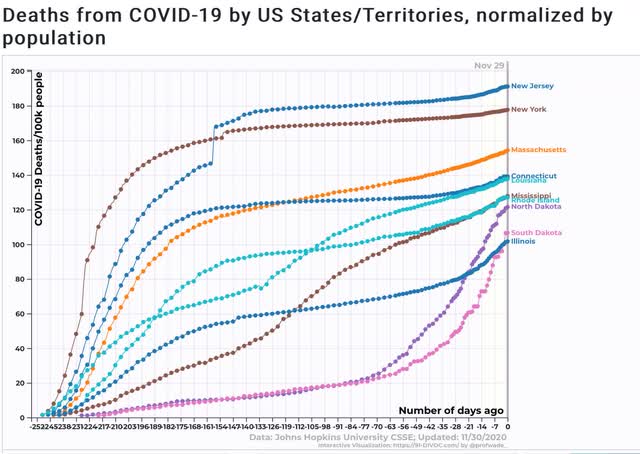
While the earliest hard hit States, NY and NJ, still have had the highest death tolls, 8 more States have suffered fatalities in excess of 1 in 1000 of their total populations:

While the Dakotas’ death tolls per capita are increasing the fastest, Mississippi, Rhode Island, and Illinois are also increasing sharply.
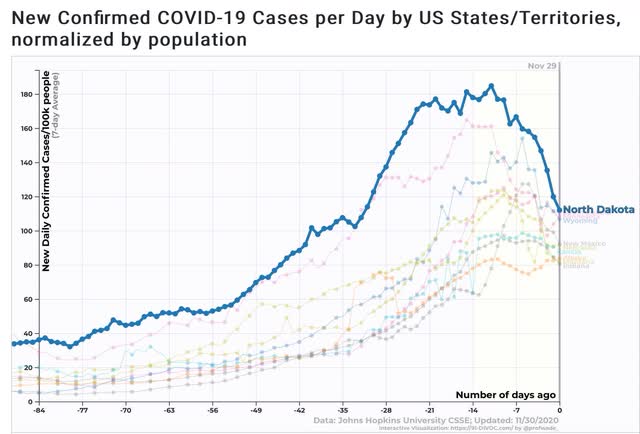
Turning to current infections, in the past week these have averaged between 80 to 115 per 100,000 residents on a daily basis in the 10 hardest hit State

There is a slight silver lining here, in that in 6 of these 10 States – North and South Dakota, Minnesota, Nebraska, Indiana, and Montana – peak infections occurred between November 14 to November 20, one to two weeks *before* Thanksgiving. In other words, the decline is not just an artifact of low reporting over the Thanksgiving holiday weekend. It seems more likely that the “libertarian” northern Great Plains States finally reached their pain threshold, where the population is frightened enough to change to more safe behaviors. Still, the death toll in those States can be expected to rise over the next several weeks, and it seems likely that the Dakotas at least will surpass the total per capita death tolls of NY and NJ by Christmas.
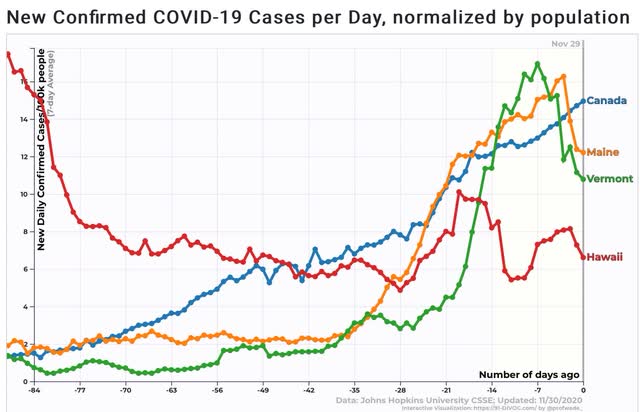
At the other end of the spectrum, there is a little “less bad” if not outright good news. Maine, Vermont, and Hawaii continue to have infection rates on par or even better than Canada, which is the benchmark success story among North American countries:

Hawaii in particular continues to appear successful in keeping the pandemic under control.

