Housing sales decline, while price surges continue So I take a little one-day road trip on my vacation and come back to find much weeping and gnashing of teeth and generalized whining about a big decline in new home sales. Well, what exactly were they expecting? The new home sales data is particularly volatile and heavily revised. So, in June, it was volatile, and May was revised substantially downward (blue in the graph below). Prices also declined, although they remain within the range of monthly noise (red): When we look at the YoY% change quarterly (to reduce noise), the prices follow sales continues to be in evidence: In absolute terms, sales peaked at the turn of the year, while prices continue to rise faster than the
Topics:
NewDealdemocrat considers the following as important: housing sales and prices, US EConomics
This could be interesting, too:
NewDealdemocrat writes JOLTS revisions from Yesterday’s Report
Bill Haskell writes The North American Automobile Industry Waits for Trump and the Gov. to Act
Bill Haskell writes Families Struggle Paying for Child Care While Working
Joel Eissenberg writes Time for Senate Dems to stand up against Trump/Musk
Housing sales decline, while price surges continue
So I take a little one-day road trip on my vacation and come back to find much weeping and gnashing of teeth and generalized whining about a big decline in new home sales. Well, what exactly were they expecting?
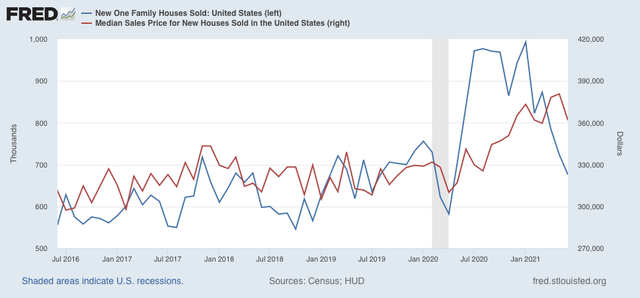
The new home sales data is particularly volatile and heavily revised. So, in June, it was volatile, and May was revised substantially downward (blue in the graph below). Prices also declined, although they remain within the range of monthly noise (red):

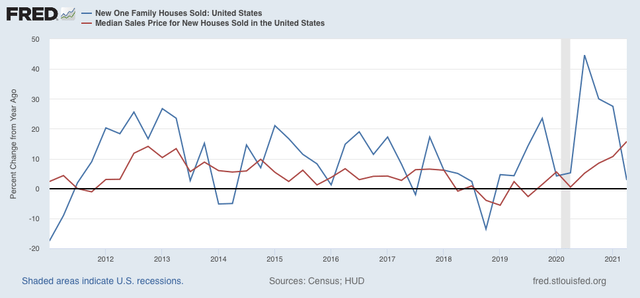
When we look at the YoY% change quarterly (to reduce noise), the prices follow sales continues to be in evidence:

In absolute terms, sales peaked at the turn of the year, while prices continue to rise faster than the pace of overall inflation.
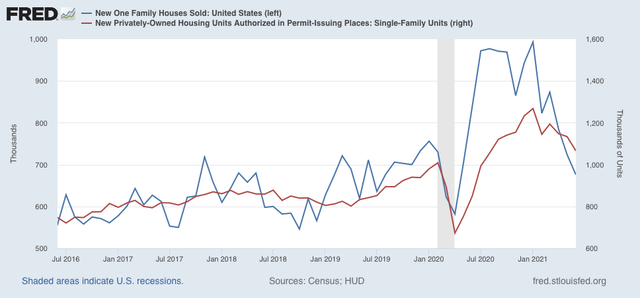
But of course, we really already knew this, because single-family housing permits give us the same information, which much more signal and much less noise, with about a 1-month delay (red in the graph below):

Sales lead prices. Once sales decline enough, sellers will get the message about prices.
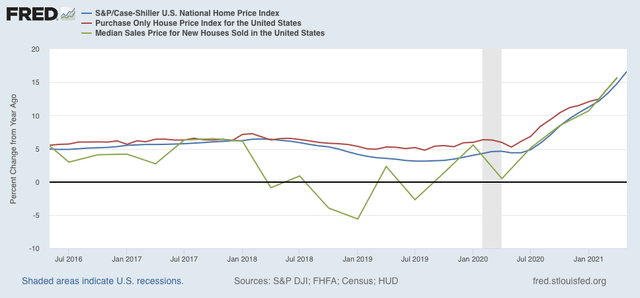
Meanwhile, this morning both the FHFA (red in the graph below) and Case Shiller (blue) house price indexes for existing homes were released, which I show YoY compared with median new house prices (green):

All three continue to show YoY acceleration in prices. As inventory of existing homes held back in 2020 continues to catch up, and supply chain disruptions dissipate, price increases will abate, and I further expect them to reverse.
