July new home sales down nearly 30% from peak, as prices perhaps start to plateau Unlike yesterday’s existing home sales, today’s report on new home sales is much more economically significant. The reason I prefer single-family housing permits as a measure is that the sales data is extremely volatile, and heavily revised over the next several months. But with those caveats, let’s take a look.New home sales (blue in the graph below) increased 1% for the month, but are still down 28.7% since their January peak: In the graph, I also show single-family permits (red) and deflated residential construction spending (gold). Not unusually, new home sales surged earlier than either of the other two metrics, peaking on a 3-month average basis last
Topics:
NewDealdemocrat considers the following as important: new home sales and prices, US EConomics
This could be interesting, too:
NewDealdemocrat writes JOLTS revisions from Yesterday’s Report
Bill Haskell writes The North American Automobile Industry Waits for Trump and the Gov. to Act
Bill Haskell writes Families Struggle Paying for Child Care While Working
Joel Eissenberg writes Time for Senate Dems to stand up against Trump/Musk
July new home sales down nearly 30% from peak, as prices perhaps start to plateau
Unlike yesterday’s existing home sales, today’s report on new home sales is much more economically significant. The reason I prefer single-family housing permits as a measure is that the sales data is extremely volatile, and heavily revised over the next several months. But with those caveats, let’s take a look.
New home sales (blue in the graph below) increased 1% for the month, but are still down 28.7% since their January peak:
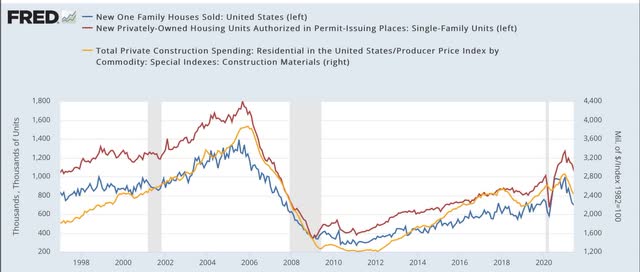
In the graph, I also show single-family permits (red) and deflated residential construction spending (gold). Not unusually, new home sales surged earlier than either of the other two metrics, peaking on a 3-month average basis last September. Permits and construction spending were far less noisy but peaked a few months later.
The inventory of new homes for sale (red in the graph below), unsurprisingly, continues to rise, as has been its typical pattern of lagging actual sales by a number of months:
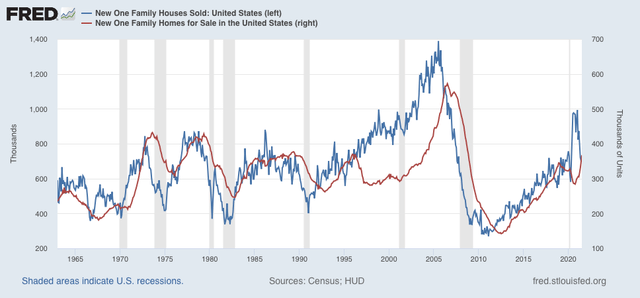
New home inventory will probably peak shortly.
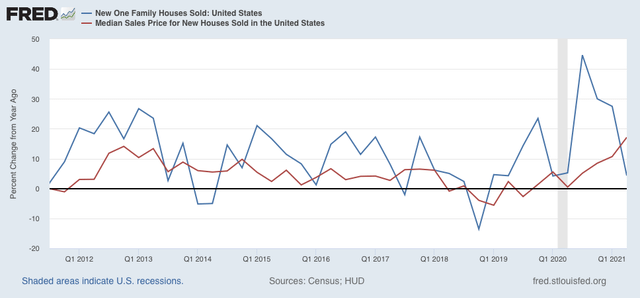
Prices have traditionally lagged sales, as shown quarterly for the past 10 years:
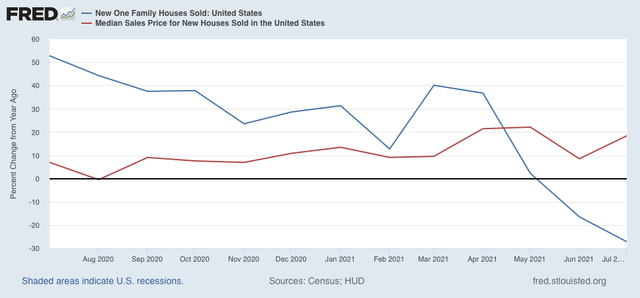
A monthly close-up of the past year shows that sales are negative YoY, while price increases may have plateaued:
Finally, the NAR does provide public access to its existing home inventory data (but unfortunately not sales) for the past 5 years here.
Below I show the YoY% change in that data (gold, inverted) compared with permits and sales:
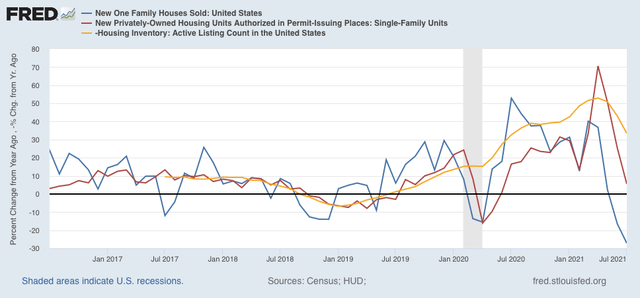
Note that in general, it tracks pretty closely with permits, just as existing home sales and new home sales have historically tracked similarly. In other words, existing home inventory is largely (not exactly!) a mirror image of existing home sales. In other words, it is more confirmatory evidence of a downturn in housing sales and construction, that has not yet resulted in a decline in prices (but I do expect it soon!), although those price increases may have started to decelerate, as the building of new inventory accelerates.