New home sales continue rebound in August, as price increases continue slight deceleration Housing is a long leading sector of the economy, and new home sales, while very noisy and heavily revised, tend to lead all of the other housing indicators. [Note: FRED hasn’t updated its charts with this morning’s information, so graphs below do not show this month]. So this morning’s m/m increase in new home sales was good news. It was an 8 month high, and at 740,000 was an increase of 14,000 from July and 39,000 from the trough in June (blue in the graph below): This confirms what single-family permits (red), which are much less noisy, suggested in last week’s report on starts and permits. The number of houses for sale (which lags the
Topics:
NewDealdemocrat considers the following as important: new home sales and prices, US EConomics
This could be interesting, too:
NewDealdemocrat writes JOLTS revisions from Yesterday’s Report
Bill Haskell writes The North American Automobile Industry Waits for Trump and the Gov. to Act
Bill Haskell writes Families Struggle Paying for Child Care While Working
Joel Eissenberg writes Time for Senate Dems to stand up against Trump/Musk
New home sales continue rebound in August, as price increases continue slight deceleration
Housing is a long leading sector of the economy, and new home sales, while very noisy and heavily revised, tend to lead all of the other housing indicators. [Note: FRED hasn’t updated its charts with this morning’s information, so graphs below do not show this month].
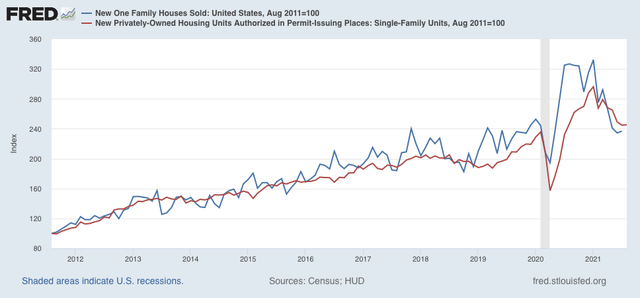
So this morning’s m/m increase in new home sales was good news. It was an 8 month high, and at 740,000 was an increase of 14,000 from July and 39,000 from the trough in June (blue in the graph below):

This confirms what single-family permits (red), which are much less noisy, suggested in last week’s report on starts and permits.
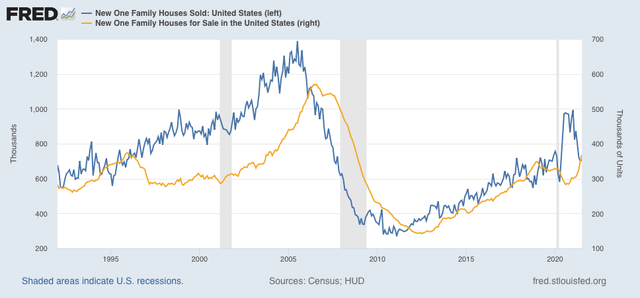
The number of houses for sale (which lags the number sold) also turned up, to 378,000, the highest level since October 2008 (gold in the graph below):

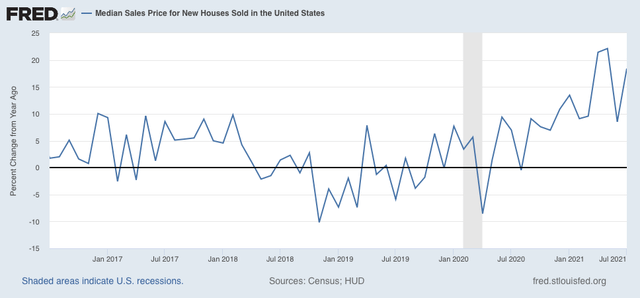
Meanwhile, the median price of a new house was 390,900, a 20% increase YoY:

This was a YoY increase from July, but below the 22% pace of April and May.
Although I pay much less attention to existing home sales, which were released Wednesday, because they have much less of an effect on the economy, there is a special issue in that data because inventory collapsed in 2020 as few people were willing to put their houses on the market.
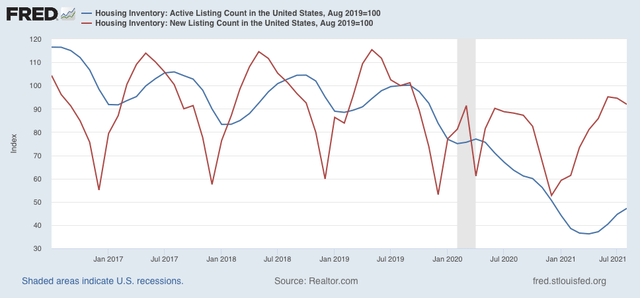
New listings in August were actually higher than one year ago, while total listings are still almost 25% lower than in August 2020. A more important comparison is with 2019, the year before inventory collapsed. In that regard, new listings in August were only -8.7% below two years ago, while total listings were less than 1/2 of that level. Below are total and new listings for existing homes, both normed to 100 as of that month:

As mortgage interest rates declined from their early year spike, new housing sales and construction have bottomed and have begun to increase. Meanwhile, price increases, which lag sales, are decelerating albeit still at a very high level due to lack of inventory of existing homes. Finally, that inventory issue is slowly correcting itself. We can expect new listings of existing homes to be higher YoY within several months, and then the issue becomes how long until inventory increases all the way back to 2019 levels.
