Clear signs of *deceleration* in house price increases, but no sign of actual declines yet The veritable explosive increase in house prices has been one of the biggest economic stories of the past year. And because it feeds into “owner’s equivalent rent” with a lag, is likely to have a big effect on consumer inflation readings in next year as well. This morning both the FHFA and Case Shiller house price indexes were reported for September, and both showed a slight deceleration in the increases in house prices. As a preliminary matter, both the FHFA and Case-Shiller indexes have risen almost an identical 250% since January 1991, when the FHFA index began: During that time, usually, the FHFA index has decelerated and made a peak or trough a
Topics:
NewDealdemocrat considers the following as important: house price increases, US EConomics
This could be interesting, too:
NewDealdemocrat writes JOLTS revisions from Yesterday’s Report
Bill Haskell writes The North American Automobile Industry Waits for Trump and the Gov. to Act
Bill Haskell writes Families Struggle Paying for Child Care While Working
Joel Eissenberg writes Time for Senate Dems to stand up against Trump/Musk
Clear signs of *deceleration* in house price increases, but no sign of actual declines yet
The veritable explosive increase in house prices has been one of the biggest economic stories of the past year. And because it feeds into “owner’s equivalent rent” with a lag, is likely to have a big effect on consumer inflation readings in next year as well.
This morning both the FHFA and Case Shiller house price indexes were reported for September, and both showed a slight deceleration in the increases in house prices.
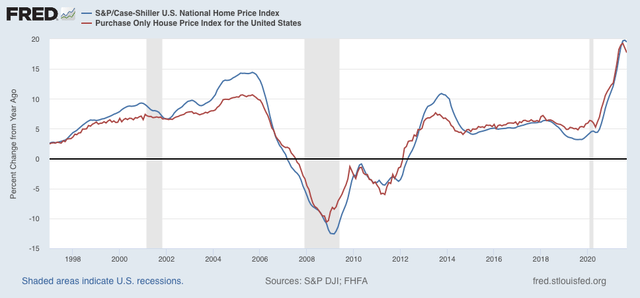
As a preliminary matter, both the FHFA and Case-Shiller indexes have risen almost an identical 250% since January 1991, when the FHFA index began:

During that time, usually, the FHFA index has decelerated and made a peak or trough a month or two before the Case Shiller index (note, for example, 1994, 2006, 2009, 2010, and 2013).
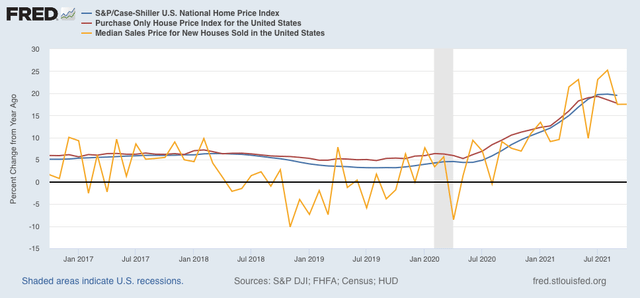
With that in mind, here are the YoY% change in house prices as measured by both indexes, plus that of new home prices (gold) zoomed in on the last 5 years (again, note that the FHFA index turned slightly ahead of the Case Shiller index in 2018 and 2020):

Last month I noted that price gains in the FHFA index had decelerated at least slightly, but that the Case Shiller Index hadn’t followed suit yet. This month the YoY% increase in prices as measured by the Case Shiller index did decelerate slightly (-0.3%) to 19.5%, while the deceleration in the FHFA Index continued, down -0.8% to 17.7%, and from the peak two months ago of 19.3% YoY.
In the last two months, I have also noted that median existing house prices as reported by Realtor.com decelerated from a 23% YoY gain to 13%, likely indicating the peak in actual prices had either just happened or was imminent. Neither the FHFA nor Case Shiller indexes are confirming that, but there is now persuasive evidence of a *slowdown* in price increases which, if it continues at its current rate of deceleration, would result in an actual peak about 6 months from now.
P.S. It is important to add that while house prices in real terms have set multiple new records this year, average monthly mortgage payments deflated by average wages are nowhere near their 2006 peak, courtesy of 3% vs. 6.5% mortgage rates.
