Coronavirus dashboard for April 20: there’s a new subvariant in town Let me start with the current overview. As of today, Nationally cases are now rising sharply, up to 41,500, an increase of 25% in the past week: Hospitalizations are generally flat at slightly over 10,000, but new admissions have risen steadily, by 8% over the last 11 days: Deaths have continued to decline, to 452, a level lower than all times during the pandemic except for 7 weeks last June and July: But, conditions have changed. Up until this week, my paradigm has been that cases in the US would follow the pattern in Europe, where once the BA.2 subvariant of Omicron reached roughly 90% of all cases, typically 2.5-3.5 weeks after the onset of the BA.2
Topics:
NewDealdemocrat considers the following as important: Healthcare, subvariant
This could be interesting, too:
Bill Haskell writes Families Struggle Paying for Child Care While Working
Joel Eissenberg writes RFK Jr. blames the victims
Joel Eissenberg writes The branding of Medicaid
Bill Haskell writes Why Healthcare Costs So Much . . .
Coronavirus dashboard for April 20: there’s a new subvariant in town
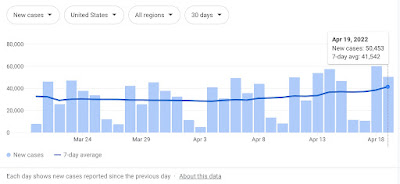
Let me start with the current overview. As of today, Nationally cases are now rising sharply, up to 41,500, an increase of 25% in the past week:
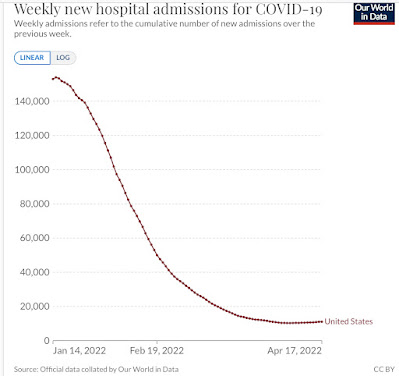
Hospitalizations are generally flat at slightly over 10,000, but new admissions have risen steadily, by 8% over the last 11 days:
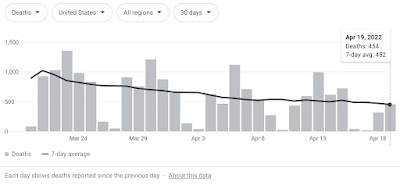
Deaths have continued to decline, to 452, a level lower than all times during the pandemic except for 7 weeks last June and July:
But, conditions have changed.
Up until this week, my paradigm has been that cases in the US would follow the pattern in Europe, where once the BA.2 subvariant of Omicron reached roughly 90% of all cases, typically 2.5-3.5 weeks after the onset of the BA.2 wave, they peaked and then declined more or less rapidly.
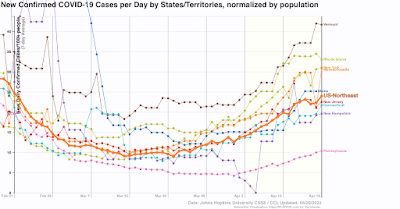
Except . . . the Northeastern part of the US did not follow the pattern. Cases bottomed 5 weeks ago, starting in New York State, and have continued to rise ever since, and are now 2.6x the number they were at their trough:
The reason why the Northeast has been different from Europe, with cases continuing to rise for over a month, was first reported by the New York State Department of Health five days ago, in a press release that stated in relevant part:
“The New York State Department of Health today announced the emergence of two Omicron subvariants in New York State, BA.2.12 and BA.2.12.1…. The subvariants have been estimated to have a 23% – 27% growth advantage above the original BA.2 variant. Over the past few weeks, the Department has been investigating higher than average infection rates in Central New York…. State health officials have determined that these highly contagious new variants are likely contributing to the rising cases. For the month of March, BA.2.12 and BA.2.12.1 rose to collectively comprise more than 70% prevalence in Central New York and more than 20% prevalence in the neighboring Finger Lakes region. Data for April indicate that levels in Central New York are now above 90%.”
In other words, here was a new subvariant with a 25% advantage even over BA.2, and displaced it almost entirely – by more than 90%! – in the region where first reported within just a few weeks.
The US had just become to BA.2.12.1 what South Africa was to the original Omicron, and Central NY was like South Africa’s Gauteng region, where BA.1 was first identified.
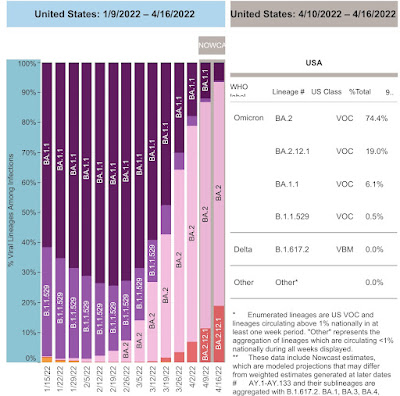
Yesterday the CDC updated their variant tracker, and for the first time included BA.2.12.1 as a separate subvariant. Here is their chart of variant proportions nationwide:
And here is the graph of the regional breakdowns:
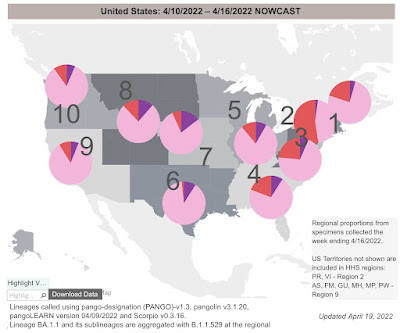
Per the report, as of last week BA.2 and it’s subvariants constituted 93.4% of all US cases. BA.2.12.1 already constitutes 19% of all US cases (up from 3.3% just 3 weeks ago, and on a trajectory equal to that of the original BA.2). At its current rate of growth, BA.2.12.1 will be over 90% of cases in the US in just 5 weeks.
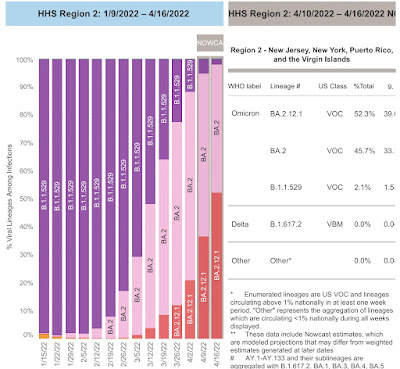
Regionally the BA.2 variants are 95% in the Northeast and over 90% along the West Coast. Further, BA.2.12.1 is already over half of all cases in NY and NJ:
Fortunately, Trevor Bedford, whose genetic work has been invaluable whenever new variants have appeared, weighed in yesterday after a three month silence. Here are the most relevant portions of his thread:
“Variant “fitness” will depend on intrinsic transmissibility and escape from existing population immunity….. BA.2’s advantage over BA.1 appears to be due to intrinsic transmissibility…. [T]he one to watch just based on mutations is B.2.12.1 which has spike mutations S704L and L452Q on top of BA.2 background. Previously, L452R appeared to have an important role in promoting the spread of Delta and also showed up in Epsilon and Lambda…. The hypothesis is then that 452R/Q is conferring some additional intrinsic transmission advantage…. This sort of accumulation of mutations that drive further host adaptation and antigenic drift is my general expectation for evolution in the coming months. It’s possible we may have additional ‘Omicron-like’ events, but my baseline is this steady ‘flu-like’ scenario.”
In short, the template of Europe’s experience with BA.2 no longer holds for the US, because of the emergence of BA.2.12.1. The US itself is the new template.
Fortunately, we have the Northeast generally, NY and NJ more specifically, and even more specifically than that the counties of the Finger Lakes and Central regions of NY State as canaries in the coal mine.
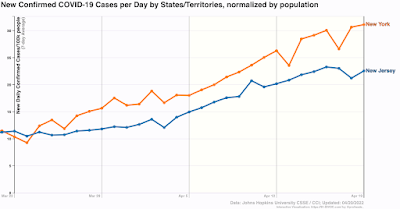
In that regard, there is some good, or at least “less bad” news. While cases in both NY and NJ are still growing, the 7 day rate of growth in NY has decelerated from 45% one week ago to under 20%, and in NJ from 35% to 12%. It is even possible cases peaked in NJ several days ago:
Further, cases have peaked already in 8 of 14 counties in the Central and Finger Lakes regions of NY region. Here’s the graph of cases for the Central NY region, where cases bottomed on March 9, and rose to their peak on April 15, a little over 5 weeks later:
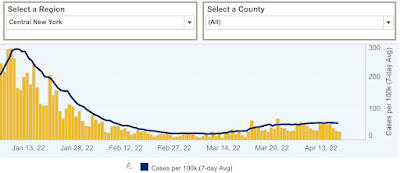
So here’s the paradigm going forward: using the “ground zero” regions of NYS as our new template, most likely cases will rise in each State until BA.2.12.1 reaches roughly 90% of all cases. We’ll get there in a couple of weeks in the Northeast, but only in about 2 months in the interior Deep South and Great Plains, where BA.2.12.1 is only about 3% of cases now. Nationwide cases began to rise 4 weeks after they did in Central New York, only two weeks ago. Thus the nationwide peak may come in about 3 to 5 weeks, by which time this new subvariant should be 90% of all cases. But in Central New York, cases tripled during their wave. A tripling of cases nationwide would be roughly 90,000.
Further, since organized public health strategies have all but disappeared in the US, the course of the pandemic will depend on the regularity of the emergence of more efficient strains. In the past 10 months, such new strains – Delta, Omicron BA.1, BA.2, and now BA.2.12.1 – have arisen about every three months. The only good news has been that the death rate has continued to decline, as gradually the population as a whole develops a level of resistance due to vaccination and/or prior infection.
