Lackluster spending, a decline in real income and savings in March; when the house price spiral turns, consumers are in real trouble In March nominal personal income rose 0.5%, and spending rose 1.1%. But since the personal consumption deflator, i.e., the relevant measure of inflation, rose 0.9%, real income declined -0.4%, and real personal spending rose only +0.2%. While both real income and spending are well above their pre-pandemic levels, I have stopped comparing them with that, but instead with their level after last winter’s round of stimulus. Accordingly, the below graph is normed to 100 as of May 2021: Since then spending is up 2.4%, while income has declined -1.3%. Comparing real personal consumption expenditures with
Topics:
NewDealdemocrat considers the following as important: leading indicators, US EConomics
This could be interesting, too:
NewDealdemocrat writes JOLTS revisions from Yesterday’s Report
Bill Haskell writes The North American Automobile Industry Waits for Trump and the Gov. to Act
Bill Haskell writes Families Struggle Paying for Child Care While Working
Joel Eissenberg writes Time for Senate Dems to stand up against Trump/Musk
Lackluster spending, a decline in real income and savings in March; when the house price spiral turns, consumers are in real trouble
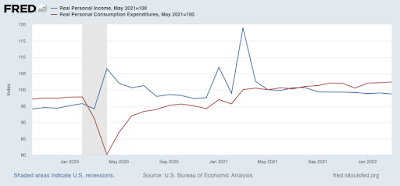
In March nominal personal income rose 0.5%, and spending rose 1.1%. But since the personal consumption deflator, i.e., the relevant measure of inflation, rose 0.9%, real income declined -0.4%, and real personal spending rose only +0.2%.
While both real income and spending are well above their pre-pandemic levels, I have stopped comparing them with that, but instead with their level after last winter’s round of stimulus. Accordingly, the below graph is normed to 100 as of May 2021:

Since then spending is up 2.4%, while income has declined -1.3%.
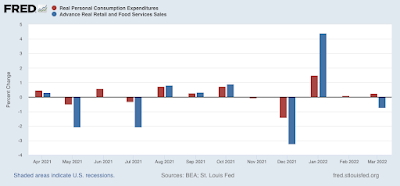
Comparing real personal consumption expenditures with real retail sales for March (essentially, both sides of the consumption coin) shows a small increase in the former and a decrease in the latter for the month. Both numbers can be considered lackluster:

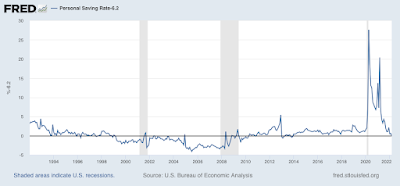
Meanwhile, the personal saving rate declined -0.7% from a revised 6.8% in February to 6.1% in March. The below graph of the last 30 years subtracts 6.1% from all months, so that the current reading is shown as 0 (before then all values were higher than 6.1%):

Usually, the savings rate has tended to decrease as expansions grow longer, leaving consumers more vulnerable to shocks (e.g., gas prices). The current value is the lowest since 2013 (when a different stimulus program ended). In other words, so far consumers are making up shortfalls by digging into savings or tapping a source of credit.
One of my recession models – the “consumer nowcast” – is based on such a shock that is unable to be made up from increased real income, or an increased source of wealth to be cashed in. Income has clearly faltered, and stocks have not made a new high in over three months. That leaves housing equity – and as you may recall from my last installment on housing sales and prices, sales have taken a distinct dive, meaning that I fully expect house prices to follow suit. Whenever that happens, unless something else reverses, consumers – and the economy – are in trouble.
