Housing permits, starts, and units under construction telegraph a deeper economic decline ahead Housing had another negative month in July. Permits (gold in the graph below) declined -1.3% to 1.674 units annualized, an 8 month low. Single family permits (red, right scale) declined -4.3% to 928,000 units annualized, the lowest since January 2020 except for the pandemic lockdown months. And the three month average of starts (blue) declined to 1.536 units annualized, the lowest since the September-November 2020 period: Total permits are still slightly higher YoY, +1.1%, but single family permits are down -11.7%: Earlier this year, I highlighted the record number of housing units that had permits, but had not yet been started, pointing out
Topics:
NewDealdemocrat considers the following as important: no recession yet, US EConomics
This could be interesting, too:
NewDealdemocrat writes JOLTS revisions from Yesterday’s Report
Bill Haskell writes The North American Automobile Industry Waits for Trump and the Gov. to Act
Bill Haskell writes Families Struggle Paying for Child Care While Working
Joel Eissenberg writes Time for Senate Dems to stand up against Trump/Musk
Housing permits, starts, and units under construction telegraph a deeper economic decline ahead
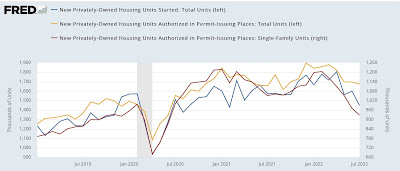
Housing had another negative month in July. Permits (gold in the graph below) declined -1.3% to 1.674 units annualized, an 8 month low. Single family permits (red, right scale) declined -4.3% to 928,000 units annualized, the lowest since January 2020 except for the pandemic lockdown months. And the three month average of starts (blue) declined to 1.536 units annualized, the lowest since the September-November 2020 period:

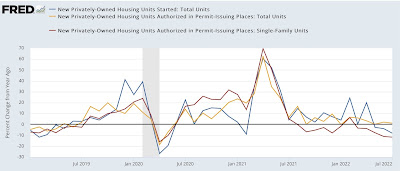
Total permits are still slightly higher YoY, +1.1%, but single family permits are down -11.7%:

Earlier this year, I highlighted the record number of housing units that had permits, but had not yet been started, pointing out that it distorts the economic signal, noting that “The conundrum is whether the 50 year high backlog in units not yet started will delay the downturn until it clears …. Since starts are the actual economic activity, until I see an unequivocal downturn there, the massive negative signal from permits, mortgage rates, and mortgage applications remains open to question.”
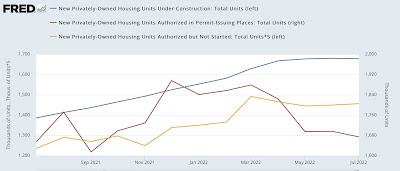
Last month permits continued to fall, and starts fell as well, verifying that signal. This month the signal became even clearer, and has also clearly spread to housing permitted but not started (gold in the graph below), and housing under construction (blue):

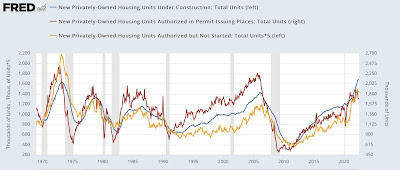
Here is the long term perspective going back 50 years:

At peaks, housing not yet started follows permits with only a short delay, with a longer delay until housing under construction peaks. Although we aren’t concerned about this at the present, note that at troughs, housing not yet started bottoms with a much greater delay compared with permits, almost as long as housing under construction.
Last month I wrote: “ Housing under construction is the ultimate coincident marker of housing economic activity. Once that begins going down, housing’s contribution to the economy is negative in real time. We are probably only a month or two from that point. In other words, the leading indicators will be joined by the coincident indicator.”
As shown above, housing under construction has been flat at its peak for the last 3 months. While housing’s contribution to the economy is not significantly negative yet, it is on the cusp of becoming so.
In the past declines of this magnitude have either corresponded with recessions, or else with near-recessions in 1966-67, 1984-85, and 1994-95. The more housing declines, and as I repeated yesterday, I am expecting further declines, the more certain a recession becomes and the deeper the trough of that recession.
