New home sales adjusted for cancellations: still signs that a bottoming process might be taking place by NewDeal democrat I had a correspondent question me about whether new home sales might actually be in the process of bottoming, due to the big increase in the percentage of cancellations, as shown below (via Bill McBride): This is something I’ve been aware of, and commented on one month ago in the context of housing that was permitted but not started. There are two responding points to be made. The first is that this is not the first time new home sales have turned down. There is no reason to believe that there weren’t similar increases in cancellation rates in any of the other downturns caused by increases in mortgage rates. So the
Topics:
NewDealdemocrat considers the following as important: new home sales and prices, US EConomics
This could be interesting, too:
NewDealdemocrat writes JOLTS revisions from Yesterday’s Report
Bill Haskell writes The North American Automobile Industry Waits for Trump and the Gov. to Act
Bill Haskell writes Families Struggle Paying for Child Care While Working
Joel Eissenberg writes Time for Senate Dems to stand up against Trump/Musk
New home sales adjusted for cancellations: still signs that a bottoming process might be taking place
by NewDeal democrat
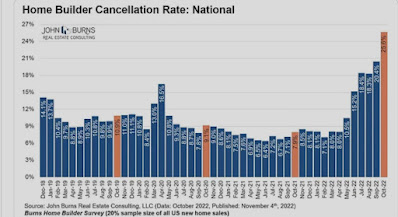
I had a correspondent question me about whether new home sales might actually be in the process of bottoming, due to the big increase in the percentage of cancellations, as shown below (via Bill McBride):

This is something I’ve been aware of, and commented on one month ago in the context of housing that was permitted but not started.
There are two responding points to be made.
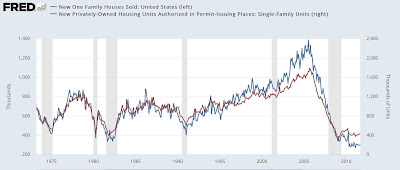
The first is that this is not the first time new home sales have turned down. There is no reason to believe that there weren’t similar increases in cancellation rates in any of the other downturns caused by increases in mortgage rates. So the pattern in new home sale was probably similar in those downturns as well:

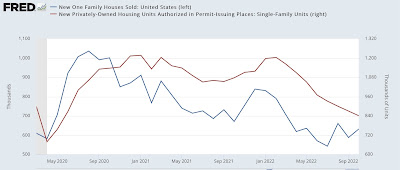
But let’s apply the data to current new home sales. Here’s the graph of the last two years I ran last Friday:

Below I show the raw data for new home sales (annualized, in thousands) in the first column, followed by the cancellation rate for that month, and finally the net sales after adjusting for cancellations:
Apr 619 8.0% 569
May 569 10.5% 509
Jun 571 15.2% 484
Jul 543 18.4% 443 (LOW)
Aug 566 18.3% 540
Sep 583 20.4% 468
Oct 632 25.6% 470
As indicated above, the adjusted low to date was in July. October’s rate was in line with September’s and June’s.
Of course, the series could certainly go lower in coming months.
But as I’ve indicated a number of times recently, now that an oncoming recession is virtually certain, I am beginning to look for signs in the long leading indicators of how long that recession might be. And new home sales, for all of its noise and heavy revisions, is one good place to start looking.
“Have new home sales made a bottom?” Angry Bear, angry bear blog
