This article by Dr. Adam Fein is drawn from the Drug Channels Institute. I can not say any of my knowledge is found in the detail of this recital. To summarize a bit as you read the detail, increases in rebates are associated with increases in list prices. Insurance coverage, the sale of drugs to distributors, sold to drug stores, via Pharmaceutical Benefit Managers is complex. Dr. Adam Fein explains how it works. He presents a couple of charts showing the revenue flows and impact. More to come later as I take a deeper dive into it. This is the start of something I have been wanting to. How does the pricing evolve for pharmaceuticals from the time it leaves the manufacturer to the time you buy it at the Drug store. It is complex. It is a part
Topics:
run75441 considers the following as important: gross-to-net bubble, Healthcare, Hot Topics, Pharmaceuticals
This could be interesting, too:
NewDealdemocrat writes JOLTS revisions from Yesterday’s Report
Joel Eissenberg writes No Invading Allies Act
Bill Haskell writes Families Struggle Paying for Child Care While Working
NewDealdemocrat writes January JOLTS report: monthly increases, but significant downward revisions to 2024
This article by Dr. Adam Fein is drawn from the Drug Channels Institute. I can not say any of my knowledge is found in the detail of this recital. To summarize a bit as you read the detail, increases in rebates are associated with increases in list prices.
Insurance coverage, the sale of drugs to distributors, sold to drug stores, via Pharmaceutical Benefit Managers is complex. Dr. Adam Fein explains how it works. He presents a couple of charts showing the revenue flows and impact. More to come later as I take a deeper dive into it.
This is the start of something I have been wanting to. How does the pricing evolve for pharmaceuticals from the time it leaves the manufacturer to the time you buy it at the Drug store. It is complex. It is a part of the why are drugs so costly question.
“Warped Incentives Update: The Gross-to-Net Bubble Exceeded $200 Billion in 2021 (rerun),” Drug Channels Institute, Dr. Adam J. Fein.
As taken from Drug Channels Institute’s annual update on the gross-to-net bubble. The update reflects a growing dollar gap between sales of brand-name drugs’ at list prices and their sales at net prices after rebates and other reductions. The relationship . . .
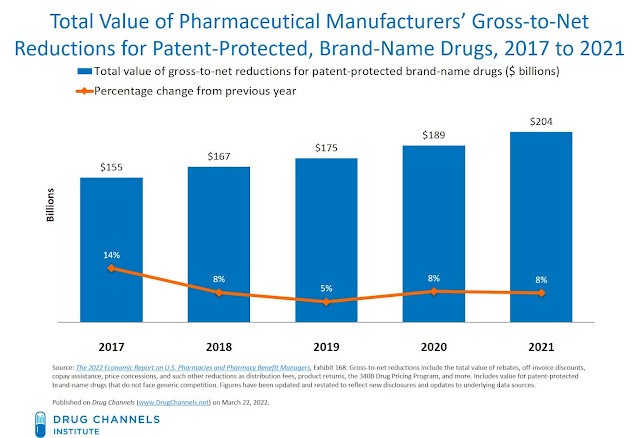
Drug Channels Institute estimates the gross-to-net bubble reached $204 billion for patent-protected brand-name drugs in 2021. This amount increases with the addition of sales of brand-name drugs losing patent protection and facing competition from generic equivalents. The bubble increases to $236 billion.
To explain why this occurs, pharmaceutical products are the only part of the U.S. healthcare system in which the difference between list and net prices is monetized as rebates and redistributed via intermediaries to payers. The bubble reflects and drives:
- patients’ affordability problems,
- intermediaries’ warped incentives, and
- politicians’ misunderstandings of U.S. drug prices.
DRUG PRICING FAQs
Some of the more frequently asked questions to help better understand pricing and its implications.
1. What are gross and net drug prices?
List Price: The manufacturer of a drug establishes the drug’s list price, called the Wholesale Acquisition Cost (WAC). A pharmacy’s revenues for a brand-name drug prescription approximate the list price, due to the typical formulas used to compute ingredient cost reimbursement.
Net Price: A drug’s net price equals the actual revenues a manufacturer earns from a drug. The net price equals its list price minus rebates and other reductions such as distribution fees, product returns, discounts to hospitals, price reductions from the 340B Drug Pricing Program, and other purchase discounts. Negotiated and statutory rebates described in the preceding section are the largest and most significant components of gross-to-net price differences. Below, is an outline of the major components of the gross-to-net price differences for brand-name drugs.
Due to the gross-to-net differences, brand-name manufacturers earn substantially less revenue than drug list prices imply, due to these gross-to-net differences between a manufacturer’s list and net prices. That’s also why net drug prices are declining even as list prices grow. (Tales of the Unsurprised: Brand-Name Drug Prices Fell for the Fourth Consecutive Year, Drug Channels, Dr. Albert Fein.)
2. What is the gross-to-net bubble?
Drug Channels Institute coined terminology “gross-to-net bubble” to describe the speed and size of growth in the total dollar value of manufacturers’ gross-to-net reductions. Drug Channel uses the word “bubble” to characterize the speed and size of growth in the total dollar value of manufacturers’ gross-to-net reductions.
A manufacturer’s gross revenues equal its revenues from sales at a drug’s Wholesale Acquisition Cost (WAC) list price. Net revenues equal its revenues from sales at a drug’s net price. The actual revenues received and reported by the manufacturer after rebates, discounts, and other reductions.
This terminology has been embraced by industry participants, the government, and others who cover the industry. The Medicare Payment Advisory Commission (MedPAC) even used the term in a 2019 Report to the Congress.
3. What does this have to do with SpongeBob SquarePants (image used to characterized a point being made)?
One of SpongeBob’s favorite pastimes is “blowing soap bubbles into elaborate shapes.”
Hence, Mr. SquarePants is the honorary mascot of the gross-to-net bubble and appears on Drug Channels whenever we discuss the topic. He also graces the set of the Drug Channels Video studio.
Compounding effect of Gross-to-Net Pricing
Through the compounding effect of gross-to-net pricing differences, the total value of manufacturers’ off-invoice discounts, rebates, and other price concessions for patent-protected brand-name drugs continues to expand. Drug Channels estimates that in 2021, the total value of gross-to-net reductions for patent-protected brand-name drugs was $204 billion.

As the list price of a manufacturer’s products rises, the dollar value of the manufacturer’s rebates and discounts grows. The manufacturer also offers larger rebates to offset the increase in list prices. Hence, the total value of the gross-to-net bubble expanded by about $15 billion (+8%) in 2021, despite the slowing growth in list prices and negative growth rates for net prices.
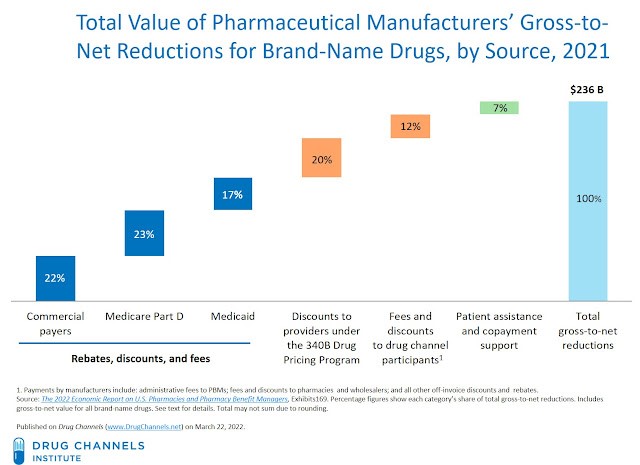
The chart below, which appears as Exhibit 169 in the 2022 pharmacy/PBM report, summarizes estimates of the major components of the gross-to-net bubble for brand-name drugs in 2021. It is estimated a majority of total gross-to-net reductions for these products come from rebates paid to third-party payers. The total value of gross-to-net reductions exceeds the figure above, due to the inclusion of brand-name drugs that have lost patent protection and face competition from generic equivalents.
SOAPY WATERS
Drug Channels has long delved into the gross-to-net bubble’s significant impact on patients.
Here are some of the most pernicious problems:
- Patients are exposed to the undiscounted list price of their prescriptions. Many people pay a coinsurance percentage of the price negotiated between the pharmacy and the plan or PBM—or even the entire list price when they are within a deductible. (See Employer Pharmacy Benefits 2021: Patient Specialty Costs Rise with Coinsurance and Accumulators.) The negotiated price the pharmacy receives for a brand-name prescription is linked most closely to a drug’s Wholesale Acquisition Cost (WAC) list price.
- Patients can pay a greater share of net price than is apparent from their coinsurance amount. Formulary rebates paid by manufacturers to plans and PBMs are not reflected in the negotiated prices between pharmacies and PBMs. Unless the plan sponsor has adopted Point of Sale (POS) rebates, patients pay a coinsurance percentage of a prescription’s undiscounted, pre-rebate list price. Consequently, a patient’s share of the net price is greater than is apparent from the coinsurance percentage computed based on the list price.
In “How Health Plans Profit—and Patients Lose—From Highly-Rebated Brand-Name Drugs,” Drug Channels Dr. Adam J. Fein follows the dollar for an expensive, highly rebated brand-name drug used by a consumer with a high-deductible health plan. As demonstrated, the consumer can pay more than twice the true discounted price of the drug. Meanwhile, the health plan pockets a large rebate.
- Seniors with Part D coverage pay more than they should. A patient’s progression through the Part D benefit tiers is based on the prescription price negotiated between the plan and the pharmacy. The negotiated price excludes rebates, so beneficiaries reach catastrophic coverage—and its unbounded 5% out-of-pocket expense—sooner when using products with higher list prices. Higher list-price products also push more beneficiaries into the catastrophic reinsurance phase, raising seniors’ out-of-pocket costs by thousands of dollars.
Congressional proposals to reform the Part D benefit design focus on capping out-of-pocket costs. Alas, no legislation has been passed.
In Section 9.3.3. of the 2022 pharmacy/PBM report, Dr. Adam J. Fein outlines other ways in which the gross-to-net bubble disrupts proper functioning of the marketplace. Despite these issues, it seems unlikely benefit designs deemphasizing rebates will be adopted anytime soon.
But like Mr. SquarePants, I’m (still) ready.
Drug Channels: “How Health Plans Profit—and Patients Lose—From Highly Rebated Brand-Name Drugs,” Dr, Adam Fein.

