Coronavirus dashboard for December 7: the first winter wave of endemicity begins – by New Deal democrat COVID is well on its way to becoming endemic, with a significant background level similar to what we have experienced in the last 8 months, and a surge during the winter months when people spend more time socializing together indoors. In that vein, it is apparent that, as expected, Thanksgiving get-togethers have triggered a new wave of COVID infections. Wastewater measures from Biobot show an apparent start to an exponential rise: This is true not just nationally but in every Census region, especially the Northeast (yellow in the graph below) but the West (green), where the increase is slower: The data is consistent with close
Topics:
NewDealdemocrat considers the following as important: coronavirus dashboard, covid, Healthcare, Hot Topics, New Deal Democrat, politics
This could be interesting, too:
Robert Skidelsky writes Lord Skidelsky to ask His Majesty’s Government what is their policy with regard to the Ukraine war following the new policy of the government of the United States of America.
NewDealdemocrat writes JOLTS revisions from Yesterday’s Report
Joel Eissenberg writes No Invading Allies Act
Ken Melvin writes A Developed Taste
Coronavirus dashboard for December 7: the first winter wave of endemicity begins
– by New Deal democrat
COVID is well on its way to becoming endemic, with a significant background level similar to what we have experienced in the last 8 months, and a surge during the winter months when people spend more time socializing together indoors.
In that vein, it is apparent that, as expected, Thanksgiving get-togethers have triggered a new wave of COVID infections.
Wastewater measures from Biobot show an apparent start to an exponential rise:
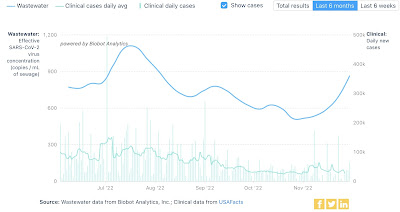
This is true not just nationally but in every Census region, especially the Northeast (yellow in the graph below) but the West (green), where the increase is slower:
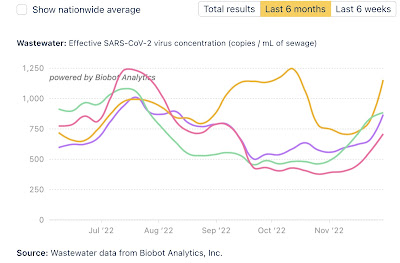
The data is consistent with close to 400,000 “real” daily cases.
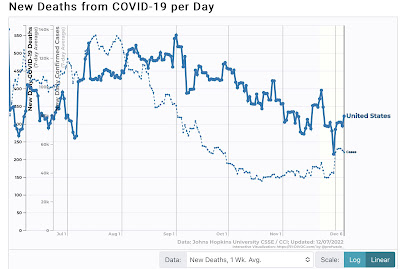
Confirmed cases have also increased from about 37,000 before Thanksgiving to 55,800 (although some of that is a data dump from New Jersey). Deaths still remain very low at 322:
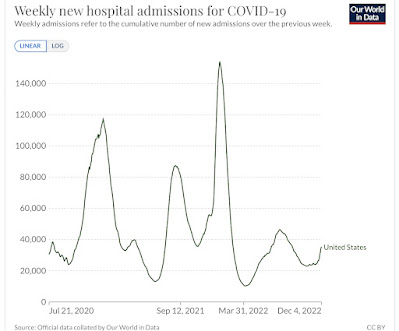
And hospitalizations have increased from 24,000 in mid-November to 34,600, 6,000 of which is just in the past 7 days:
More holiday get-togethers will only make this incipient winter wave worse.
Unfortunately, part of this is the very poor uptake of the new bivalent booster shot. Per Dr. Eric Topol, “Only 1 in 3 American seniors have been boosted in [the past] 6 months.”
Hospitalizations for seniors, at least in some States, are higher than they have been since the original Omicron wave one year ago:
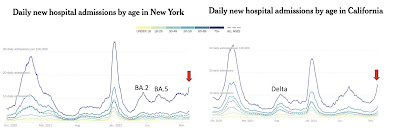
This is particularly exasperating, since the CDC just updated their data showing that being fully boosted lowers seniors’ risk of hospitalization by 80%:
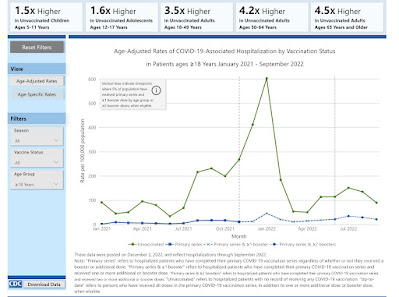
Although mitigation efforts like masking have all but evaporated, my template is that this wave will likely be similar to the BA.1.12.1 and BA.5 waves earlier this year, both of which peaked at roughly 125,000 confirmed cases and 500 deaths per day. This peak will probably be in about mid-January.
“Coronavirus dashboard for Thanksgiving week 2022,” – Angry Bear, angry bear blog
