I am hopping around a bit in this commentary. Fair warning. These are different versions taken from various authorities, different periods of time, and saying similar or the same thing. I am going to try to connect the dots here between some old and some more recent occurrences. Costs and prices keep rising in healthcare and are outstripping out ability to pay. Healthcare costs and the resulting prices keep rising and yes even in the price-controlled Medicare and Medicaid sectors. I am attempting to show a practice and probably a pattern of price and cost increases by Healthcare. Links are attached so the reader can deep dive some of the information presented. I would love to say much of this is from my own research. It is not. I am taking from
Topics:
run75441 considers the following as important: Healthcare, politics
This could be interesting, too:
Robert Skidelsky writes Lord Skidelsky to ask His Majesty’s Government what is their policy with regard to the Ukraine war following the new policy of the government of the United States of America.
Joel Eissenberg writes No Invading Allies Act
Ken Melvin writes A Developed Taste
Bill Haskell writes The North American Automobile Industry Waits for Trump and the Gov. to Act
I am hopping around a bit in this commentary. Fair warning. These are different versions taken from various authorities, different periods of time, and saying similar or the same thing. I am going to try to connect the dots here between some old and some more recent occurrences. Costs and prices keep rising in healthcare and are outstripping out ability to pay.
Healthcare costs and the resulting prices keep rising and yes even in the price-controlled Medicare and Medicaid sectors. I am attempting to show a practice and probably a pattern of price and cost increases by Healthcare. Links are attached so the reader can deep dive some of the information presented. I would love to say much of this is from my own research. It is not. I am taking from various resources.
What you are looking at here is a pattern of practice from 1996 to 2022 in the rising costs of healthcare and som reasoning or basis as to why it is happening.
Why Do Healthcare Costs Keep Rising?
Americans spend large amounts of money on healthcare each year. Included in are High healthcare insurance premiums with high deductibles, and additional co-pays making up much of this spend. As an example, you will have to fulfill the pharma drug deductible limit before your drug is discounted by insurance. The thought is you would fulfill the limit sooner by doing so. Except in many cases, people never reach the deductible limit yearly and are stuck paying the full price. This is a change from years ago when you always received a discounted price. Many or most people do not hit the full deductible before insurance kicks in.
Commercial healthcare insurance has figured out ways to spread the rising costs of getting care. The out-of-pocket expenses spread amongst three areas of costs (above) are what is associated with health and wellness in the country.
Medicaid and Medicare
Government sponsored Medicaid and Medicare insures the poor and the elderly. Both groups would find commercial healthcare insurance too expensive and less efficient. This is not to say there is no waste in Medicare, etc. Even with its waste “Fee for service” Medicare can deliver less costly healthcare than what commercial healthcare insurance charges and you would pay. Medicaid Healthcare Insurance is less costly, because it pays even less to providers. Some healthcare providers and healthcare facilities reject Medicaid.
Medicare Advantage
There is also government sponsored. Commercial Medicare Advantage being offered as competition to FFS Medicare. MA plans bid on providing healthcare and are paid more to care for its patients. It has also been found to deliberately over code its patients.
Coding intensity varies significantly across MA plans. Increasing diagnostic coding allows some plans to offer excessive benefits, attracting more enrollees and undermining the goal of plans competing on the basis of quality and costs. MedPac Page 439 Chapter 12.
Some history
MA Coding
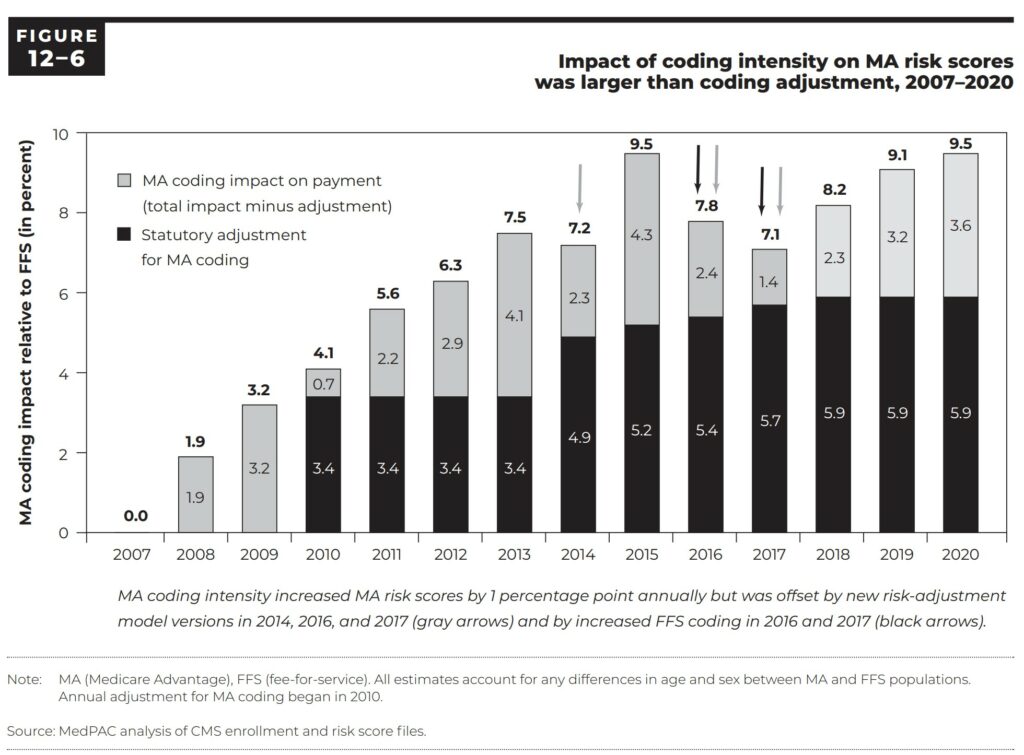
Analysis of 2020 data depicted in figure 12-6 shows higher MA diagnosis coding intensity (preliminary?). The Medicare Advantage (MA) risk scores were about 9.5 percent higher than scores for similar Fee For Service Medicare beneficiaries (MedPac 2020, page 413) in 2020. In 2020, the adjustment by CMS reduced MA risk scores by 5.9 percent. Similar reductions can be seen from 2014 – 2020. The reductions in MA risk scores reducing payments still resulted in payments of 1.4% – 3.6 percent higher than would have been if MA enrollees had been treated in FFS Medicare. This translated to $12 billion in over payments to MA plans in 2020.
“In 2022, MA bid an average 85 percent of FFS spending for its care. The payment benchmarks were averaging 108 percent of FFS — resulting in MA payments that are 100 percent of FFS and an estimated 104 percent of FFS spending after accounting for differences in coding practices between MA and FFS (MedPac 2020, page 421).”
To analyze MA data, CMS samples data and determines the overall amount of error there would be.
Lets step back a bit here and analyze what we have talked about before.
Five Factors Impact the Cost of Healthcare Outside of Commercial Healthcare Insurance
A (JAMA) study found five factors affecting the cost of healthcare:
These 5 factors impact spending and varies by type of care and health condition.
Healthcare Spending
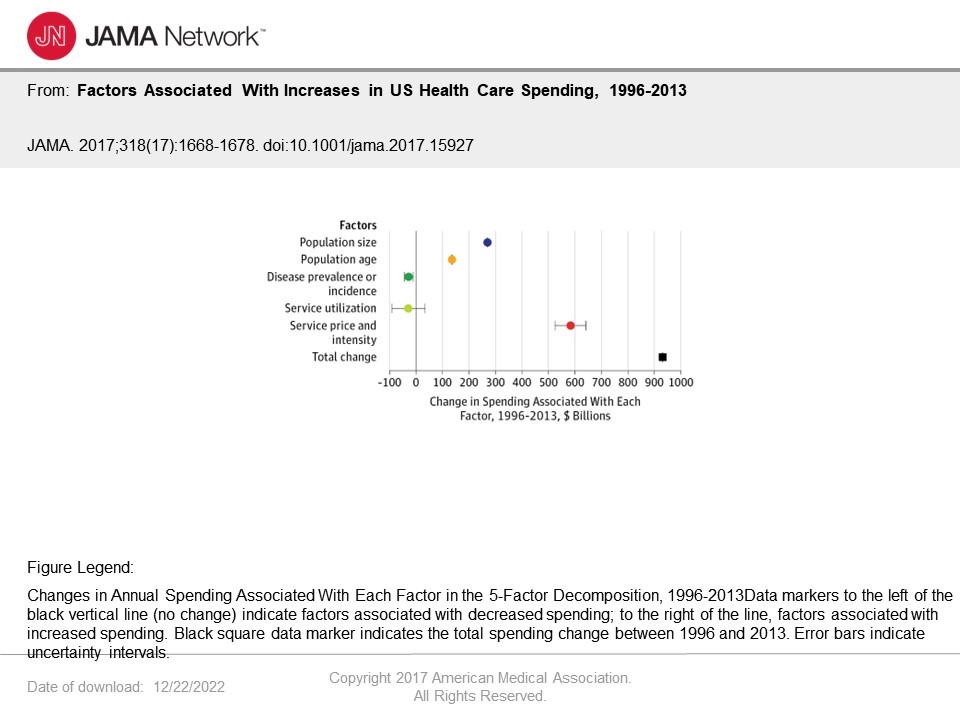
The1996 to 2013 JAMA study revealed after adjustments for price inflation, the annual health care spending on inpatient, ambulatory, retail pharmaceutical, nursing facility, emergency department, and dental care increased by $933.5 billion in that time period. The increases fueled healthcare cost increases from $1.2 trillion to $2.1 trillion.
What is significant and depicted in the chart above is the “changes in service price and intensity. these were associated with an ~50.0% (UI, 45.0%-55.0%), or $583.5 (UI, $525.2-$641.4) billion, spending increase.
Making a leap here and going back to Dr. F. Perry Wilson’s “Here’s What’s Really Driving Healthcare Costs.” In a comparison to other public expenses, Dr. Perry paints a picture most people can associate with practically. For example, the increase in medical costs of $933.5 billion provide . . .
“enough money to create 9 additional interstate highway systems, fully fund 3 NASAs every year, or provide 400 malaria nets to every man, woman, and child in Africa.”
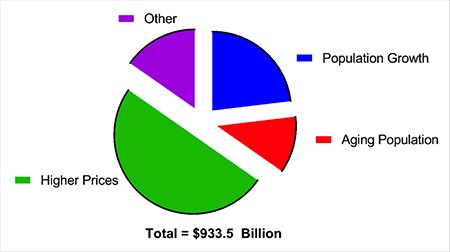
For the numerically challenged, service price and intensity shown as higher prices is depicted pictorially in green.
Some of the spending is the result of the aging (red) of the US population and population growth (blue). Not much can be done with either cause. However, the increase is associated with higher prices.
Price increases versus Service Utilization
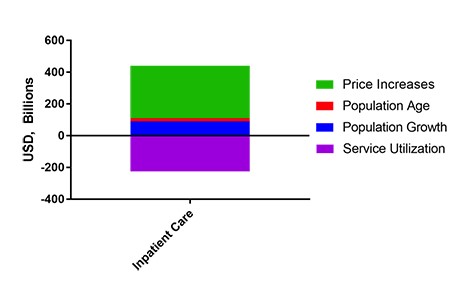
Price increases is distinctly different than Service Utilization. As the bar chart below shows, Service Utilization decreased.
Inpatient care in hospitals, etc. (a part of service utilization [purple]) decreased substantially from 1996 – 2013. What occurred in healthcare was an increased movement to outpatient treatment.
What is an interesting and nonrelated result of this change (inpatient to outpatient) is the remaining Inpatient pricing increased much more than the decrease in Service Utilization costs. The remaining price of Inpatient care went up much more, increasing overall inpatient spending by an approximate $250 billion dollars.
Normally usage decreases could result in increased pricing as you lose volume efficiency and associated discounts. Dr. Perry points out how weird the increase is economically as the expected result was a decrease in total costs. Demand for Inpatient healthcare decreased over time and associated prices increased as well as total costs. That is not an efficient market.
Biggest Price Increase was seen in diabetes care
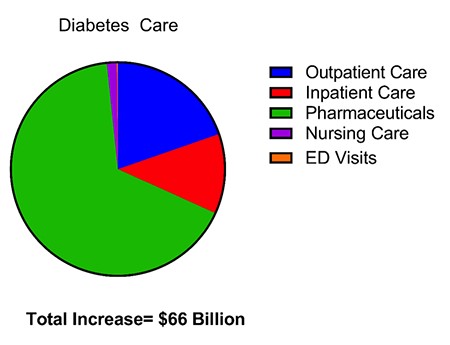
Different chronic diseases had different patterns of price increases. The biggest increase was seen in diabetes care, as can be seen in the chart below.
Dr. Perry attributes the increases in Diabetes Care as being largely due to the rising costs of the associated pharmaceuticals particularly Insulin. A bit of history . . .
“In 1996, (Eli Lilly’s Humalog first came out), the price for a 1-month supply of insulin was $21. As of 2001, that exact vial’s price increased by $14 to $35. Now, in 2019, that vial is said to be around $275. That is a 1200% increase on the original price.” The Deadly Costs of Insulin (ajmc.com).
Middlemen Drove Price Increases
The actual costs and price for insulin are largely due to the distribution from the manufacturer to the drug store with multiple intermediators such as PBMs and distributors (McKesson, Cardinal, Amerisource-Bergen Drug Co., etc.) in between (sued by West Virginia) and associated discounts. Manufacturers do make money on insulin and other drugs regardless of what is said and even after discounts. The total increase in pricing was an approximate $50 billion for Insulin. Some seem to think this small in the scheme of things.
And the manufacturer is still king. One would think there would be price competition amongst the manufacturers of Insulin. If there is, it has not been apparent. The same struggle that was seen of the affordability of EpiPens has been experienced with Insulin an old drug. (Vimovo scan)
It is the prices which are driving healthcare costs. Even with FFS Medicare, the care has an approximate 30% waste as quoted bt fromer CMS Director Berwick.
“Why Do Healthcare Costs Keep Rising?” (investopedia.com)
“Factors Associated with Increases in US Health Care Spending, 1996-2013,” PMC (nih.gov), Authors
“Factors Associated with Increases in US Health Care Spending, 1996-2013,” Health Care Economics, Insurance, Payment, JAMA Network, Joseph L. Dieleman; Ellen Squires; & Anthony L. Bui
“Here’s What’s Really Driving Healthcare Costs,” MedPage Today, F. Perry Wilson
The Cash Monster Was Insatiable’: How Insurers Exploited Medicare for Billions – PNHP

