– by New Deal democrat Recently I have paid much more attention to the ISM services index. That’s because, since the turn of the Millennium, manufacturing’s share of the economy has contracted to the point where even a significant decline in that index has not translated into an economy-wide recession, as for example in 2015-16. When we use an economically weighted average of the non-manufacturing index (75%) with the manufacturing index (25%), it has been a much more reliable signal, particularly when we use the 3 month average, requiring it to be below 50. Once again this month the contraction shown in the manufacturing index has been more than counterbalanced by continued expansion in the services index, which was reported at 54.9. The
Topics:
NewDealdemocrat considers the following as important: ISM Services, US EConomics
This could be interesting, too:
NewDealdemocrat writes JOLTS revisions from Yesterday’s Report
Bill Haskell writes The North American Automobile Industry Waits for Trump and the Gov. to Act
Bill Haskell writes Families Struggle Paying for Child Care While Working
Joel Eissenberg writes Time for Senate Dems to stand up against Trump/Musk
– by New Deal democrat
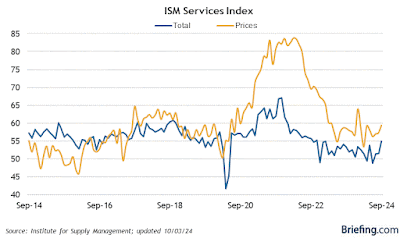
Recently I have paid much more attention to the ISM services index. That’s because, since the turn of the Millennium, manufacturing’s share of the economy has contracted to the point where even a significant decline in that index has not translated into an economy-wide recession, as for example in 2015-16.
When we use an economically weighted average of the non-manufacturing index (75%) with the manufacturing index (25%), it has been a much more reliable signal, particularly when we use the 3 month average, requiring it to be below 50.
Once again this month the contraction shown in the manufacturing index has been more than counterbalanced by continued expansion in the services index, which was reported at 54.9. The more leading new orders subindex (not shown in the graph below) came in stronger, at 59.4:
Here are the last six months, including September, of both the manufacturing (left column) and non-manufacturing index (center column) numbers, and their monthly weighted average (right) :
APR 49.2 49.4. 49.3
MAY 48.9. 53.8. 52.5
JUN 48.5. 48.8. 48.7
JUL. 46.8. 51.4. 50.2
AUG. 47.2. 51.5 50.4
SEP. 47.2. 54.9 53.0
And here is the same data for the new orders components:
APR 49.1. 52.2. 51.4
MAY 45.4. 54.1. 51.9
JUN. 49.3 47.3. 47.8
JUL. 47.4. 52.4. 51.2
AUG. 44.6. 53.0. 50.9
SEP. 46.1. 59.4. 56.1
While the single month average for both the headline and new orders components showed contraction in June, but it did not trigger a signal based on the three month average. Last month the three month weighted average of the headline numbers was 49.7, and the new orders component 49.97, which rounded to 50.0.
With this month’s data, the three month headline average for manufacturing is 47.1, and for non-manufacturing is 52.6. That makes the economically weighted headline average 51.2. For new orders the weighted three month average is 52.7.
Essentially, with the poor June readings for the new orders subindex in particular out of the average, the economically weighted ISM indicator has returned to a moderately positive aggregate reading. This is good news.
Tomorrow I will be looking to see what happens with manufacturing and construction jobs in particular, and whether new entrants to the labor force continue to distort the unemployment rate higher. We’ll see then.
ISM weighted manufacturing + services indexes signal continued expansion – Angry Bear, by New Deal democrat

