Former Bear Bill McBride at Calculated Risk is sharing another of his excellent commentaries. This time his focus is on rising homeowner insurance costs. Timely for sure. Helene has gone through the southern states and another hurricane is coming. Insurance costs were up then and will more-than-likely increase again for states bordering the Atlantic. I have noticed our HO Insurance taking a jump also. CalculatedRisk Newsletter by Bill McBride Press Release: ICE Mortgage Monitor: Average Payment Hits All-Time High; Spiking Insurance Costs Rising at 3X the Rate of Principal, Interest, and Taxes The average monthly payment (principal, interest, taxes and insurance, or PITI) among active mortgages hit a record ,070 in August; up 0
Topics:
Angry Bear considers the following as important: US EConomics
This could be interesting, too:
NewDealdemocrat writes JOLTS revisions from Yesterday’s Report
Bill Haskell writes The North American Automobile Industry Waits for Trump and the Gov. to Act
Bill Haskell writes Families Struggle Paying for Child Care While Working
Joel Eissenberg writes Time for Senate Dems to stand up against Trump/Musk
Former Bear Bill McBride at Calculated Risk is sharing another of his excellent commentaries. This time his focus is on rising homeowner insurance costs. Timely for sure. Helene has gone through the southern states and another hurricane is coming. Insurance costs were up then and will more-than-likely increase again for states bordering the Atlantic. I have noticed our HO Insurance taking a jump also.
CalculatedRisk Newsletter
by Bill McBride
- The average monthly payment (principal, interest, taxes and insurance, or PITI) among active mortgages hit a record $2,070 in August; up $140 (+7.2%) from last year and $399 (+19.3%) since the start of 2020
- Average PITI on loans originated in the last two years is $600 per month higher than that of 2020/2021 vintage mortgages, with two-thirds of each payment devoted to paying down interest
- In contrast, just 12% of the monthly payment among 2023/24 mortgages goes directly toward principal reduction – less than half the comparative average for other recent vintages
- Though older loans have lower PITI, 35% of those payments go toward variable costs, such as taxes and insurance, that are at risk of increase even as principal and interest components remain fixed
- All aspects of mortgage payments are rising as home prices, loan balances, interest rates and taxes have trended higher, with average principal, interest and tax payments up 15-17% since the start of 2020
- Increased property insurance costs stand out; the average monthly insurance payment is up 52% since the start of 2020, with increases in some higher-risk areas as high as 90% over that same period
- Rising premiums are due, in part, to higher home prices, but a direct comparison of mortgages analyzed shows a sharp jump from an average $4.65 per $1K covered from 2013-2022 to $5.38/$1K in July 2024
- In New Orleans and Miami, property insurance is ~$17/$1K in coverage, more than 3X the U.S average; higher costs also extend beyond hurricane zones and into the tornado and hail risk of the central states
- On average, insurance premiums account for 9.4% of monthly mortgage payments, up from less than 7.7% from 2013-2020, hitting their highest share on record
- In high-risk areas, property insurance can make up as much as 25% of the average mortgage holder’s overall monthly PITI payment
emphasis added
Mortgage Delinquencies Declined in August
Here is a graph on delinquencies from ICE. Overall delinquencies decreased slightly in August and are below the pre-pandemic levels. Source: ICE McDash.
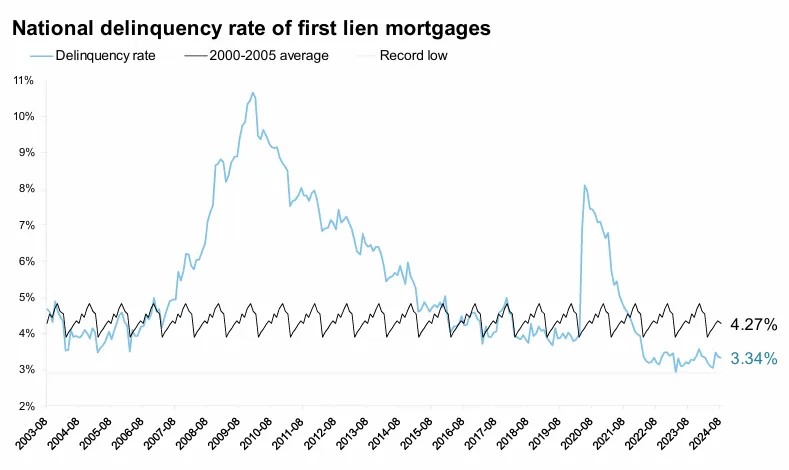
- The national delinquency rate fell 3 basis points (bps) to 3.34% in August, dropping 0.9% for the month but up 5.1% from last year
- The number of borrowers a single payment past due dropped by -26K, while 60-day delinquencies rose marginally by 1K
- Serious delinquencies (loans 90+ days past due but not in active foreclosure) rose 14K (+3.3%) to a six-month high, but remain historically low
- Nearly 70% of seriously delinquent mortgages are still protected from foreclosure via either forbearance, loss mitigation, or bankruptcy
Insurance Costs “Spiked”
Here is a graph of the average annual insurance premium per $1,000 of coverage.
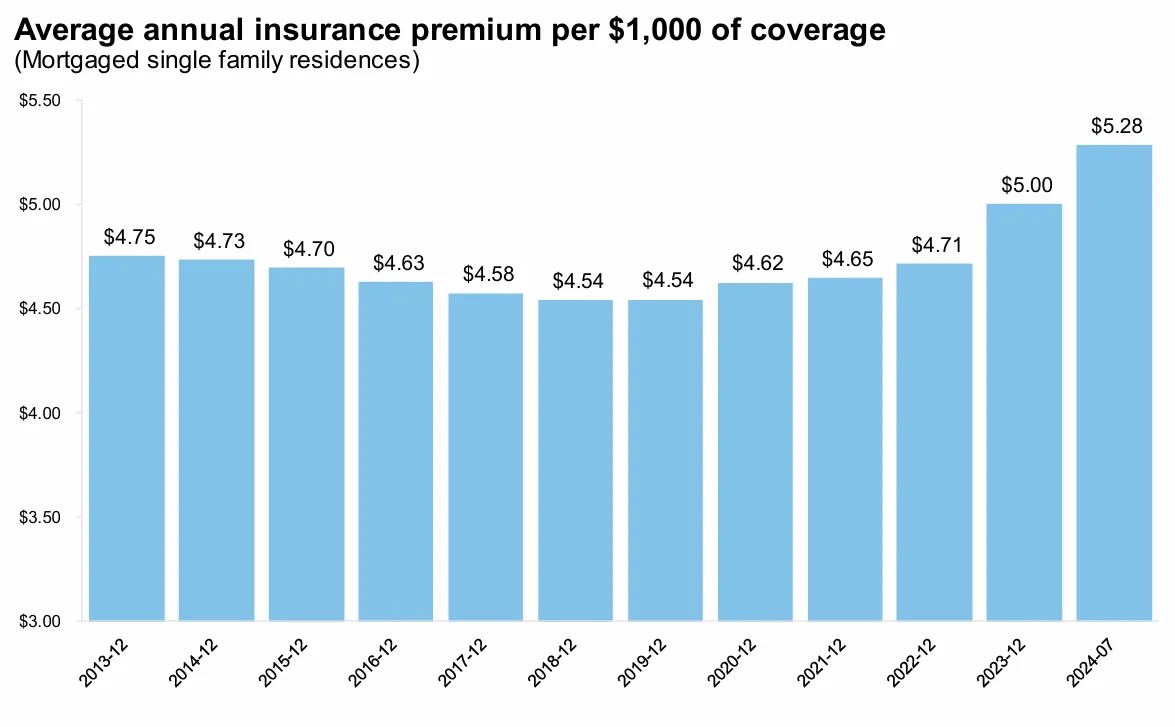
Source: ICE McDash +Property Insurance
- While rising insurance premiums are due, in part, to higher home prices, the cost per $1,000 of coverage has been rising sharply as well
- For example, the annual insurance premium per $1,000 in coverage has risen from an average of $4.65 from 2013 – 2022 to $5.38 in July, up 12% ($0.57) over the past 19 months
- It’s also worth noting that property insurance coverage amounts are typically based on replacement costs rather than the total underlying value of a home, with coverage amounts as a share of underlying home values shrinking from over 100% in 2013-2015 to 88% today
The largest insurance increases are in Florida (for obvious reasons). Please stay safe this week with Hurricane Milton!
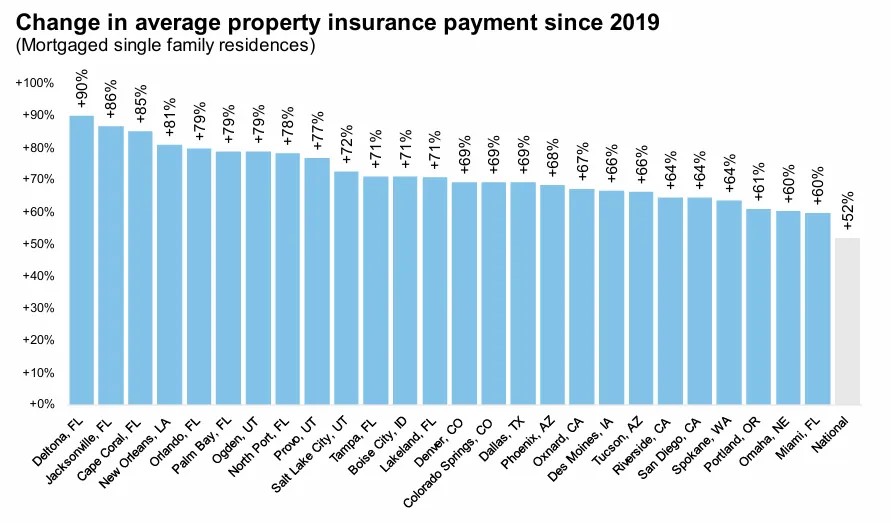
- While monthly principal, interest, and property tax obligations are up an average 15-17% since the beginning of 2020, the average monthly property insurance payment is up a whopping 52% over that same period
- In New Orleans, as well as Florida markets such as Deltona, Jacksonville and Cape Coral, monthly property insurance payments increased more than 80%
- Premiums also surged in areas with rising home values, including Utah; Boise, Idaho; and Midwest/Eastern Slope markets like Omaha, Denver and Colorado Springs, which have faced increased risks from tornados and hail damage
“Annual price growth slowed to +3.0%”
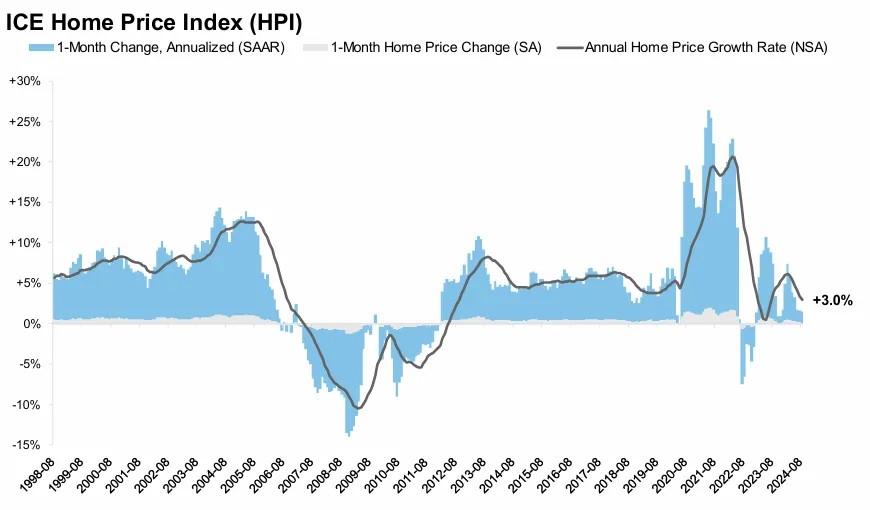
Source: ICE Home Price Index (HPI)
- Home prices continued to cool in August, up +3.0% from the same time last year, according to the ICE Home Price Index, marking the slowest rate of home price growth in over a year
- On an adjusted basis, prices rose by +0.12% in the month – the slowest growth since last November – equivalent to a seasonally adjusted annualized rate (SAAR) of +1.4%
- While soft monthly gains suggest that the annual home price growth rate may slow further in September, annual growth may be poised to catch two different tailwinds in coming months
- The first will come from softer comparable sales in late 2023, when mortgage rates climbed above 7.5%; the second, from easing 30-year rates and improved affordability in September
- October prices will be driven by 30-year rates that have been in the low 6% range, whereas a far more favorable rate environment than July, when rates were in the high 6s
- It will be worth watching the housing supply/demand and price dynamics in coming months, given the sharp downward trend in mortgage rates in recent weeks
There is much more in the mortgage monitor.