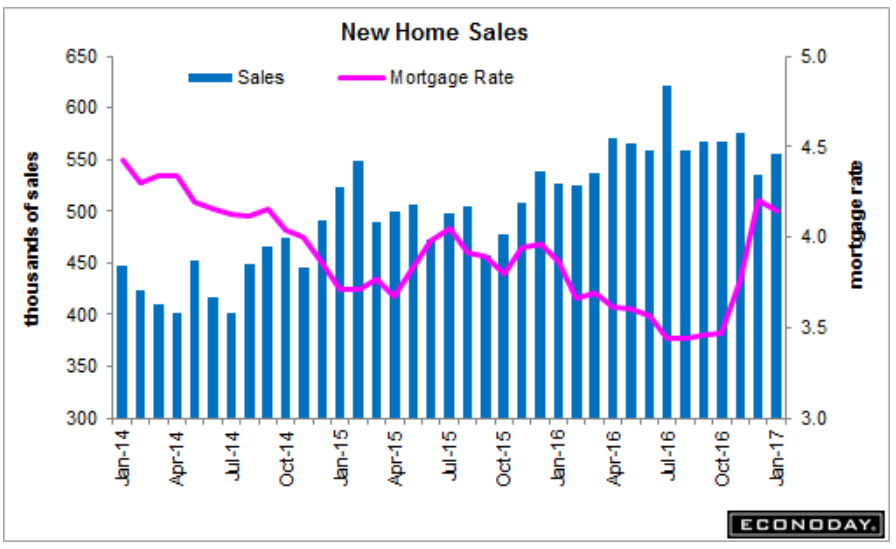
Up, though less then expected. Nothing here to suggest any kind of economic acceleration: Highlights New home sales have lost some traction and it’s not because of tightening supply. At 555,000, January’s annualized pace came in more than 20,000 below the Econoday consensus and includes a big downward revision, not to December which is 1,000 lower at 535,000, but the cycle high in November which has been cut by 23,000 to 575,000. This report is one of the most volatile on the calendar which puts the priority on moving averages including the 3-month average which has fallen steadily from a cycle peak of 587,000 in September to only 555,000 (which is the same as January’s rate). Supply, however, is no longer as thin as it was, at 5.7 months at the January sales rate vs low 5 month rates through most of last year. The number of new homes on the market, at 265,000 for a 3.5 percent monthly jump, is a new cycle high (since July 2009). Permits for single-family homes have been on the climb which points to more supply ahead. Rising supply is a negative for prices and at 2,900, the median fell 1.0 percent in the month. The year-on-year rate, however, is still very solid at 7.5 percent. For regional sales, the West is making the most news right now with a 16.2 percent year-on-year gain to a 151,000 rate. The South, at a 290,000 rate, is down 1.
Topics:
WARREN MOSLER considers the following as important: Uncategorized
This could be interesting, too:
tom writes The Ukraine war and Europe’s deepening march of folly
Stavros Mavroudeas writes CfP of Marxist Macroeconomic Modelling workgroup – 18th WAPE Forum, Istanbul August 6-8, 2025
Lars Pålsson Syll writes The pretence-of-knowledge syndrome
Dean Baker writes Crypto and Donald Trump’s strategic baseball card reserve
Up, though less then expected. Nothing here to suggest any kind of economic acceleration:

Highlights
New home sales have lost some traction and it’s not because of tightening supply. At 555,000, January’s annualized pace came in more than 20,000 below the Econoday consensus and includes a big downward revision, not to December which is 1,000 lower at 535,000, but the cycle high in
November which has been cut by 23,000 to 575,000. This report is one of the most volatile on the calendar which puts the priority on moving averages including the 3-month average which has fallen steadily from a cycle peak of 587,000 in September to only 555,000 (which is the same as January’s rate). Supply, however, is no longer as thin as it was, at 5.7 months at the January sales rate vs low 5 month rates through most of last year. The number of new homes on the market, at 265,000 for a 3.5 percent monthly jump, is a new cycle high (since July 2009). Permits for single-family homes have been on the climb which points to more supply ahead.
Rising supply is a negative for prices and at $312,900, the median fell 1.0 percent in the month. The year-on-year rate, however, is still very solid at 7.5 percent.
For regional sales, the West is making the most news right now with a 16.2 percent year-on-year gain to a 151,000 rate. The South, at a 290,000 rate, is down 1.0 percent on the year. The two smaller regions, the Midwest and Northeast, both show gains.
This report is constructive though the pace of the new home market is slowing, perhaps the result of higher mortgage rates or lack of income punch among prospective buyers.

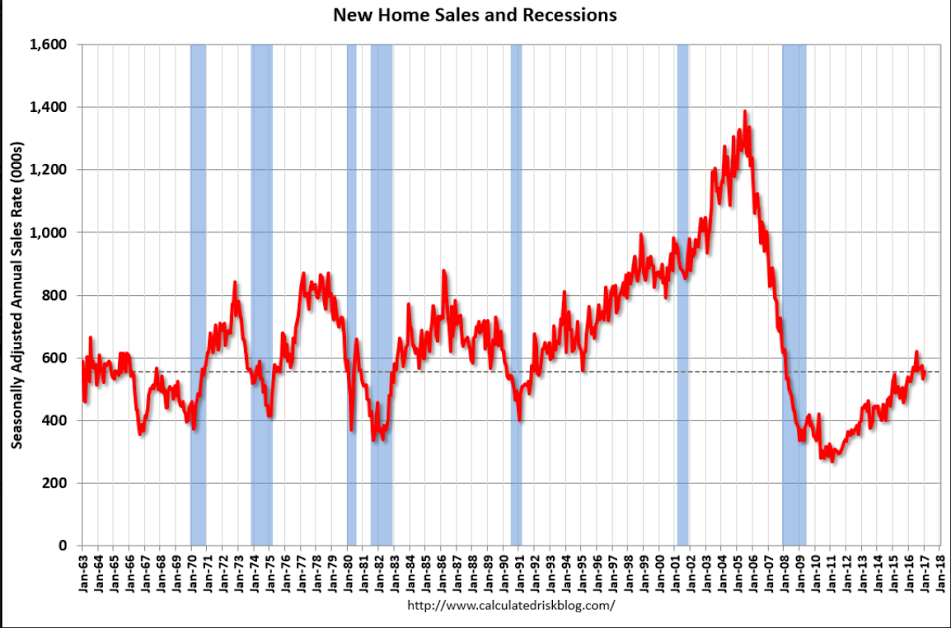
still depressed by historical standards:


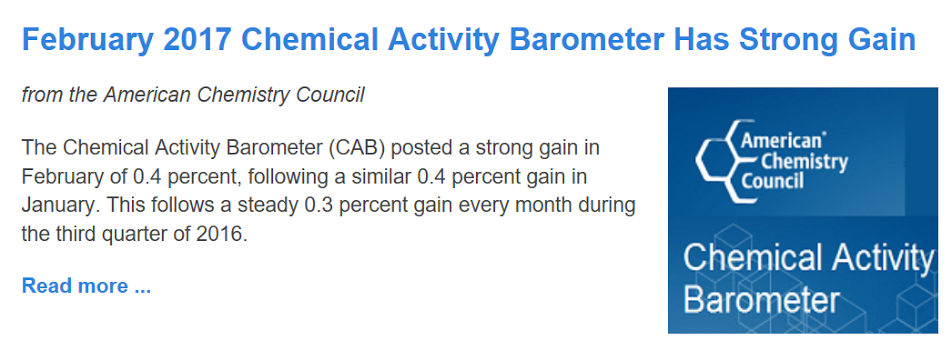
Like manufacturing, these seem to have bottomed and is now muddling through at the lower levels, as weakness spread to the service sector:

This makes sense to me:
